[Understanding Trends II] || Crypto Academy S5W3 || Homework Post For Professor @reminiscence01|| BY @saarah
Greetings to Everyone
Hope you all are fine and in good health!
Today i am going to participate in the Home Work Task of Season 5 Week 3 Which is "Understanding Trends II" given by the Professor @reminiscence01.
I am very excited to attending this homework task and i would say thanks to Professor @reminiscence01 on his remarkable efforts in Crypto Academy.
.jpg)

Question# 1
a) Explain your Understanding of Trend Reversal. What is the benefit of identifying reversal patterns in the Market?
Trend Reversal
There are basically two trends in the market as we all know. They are bearish or downtrend and bullish or uptrend. When we see the price line trending down, we call it a downtrend and when we see the price trending higher, we call it a bullish trend.
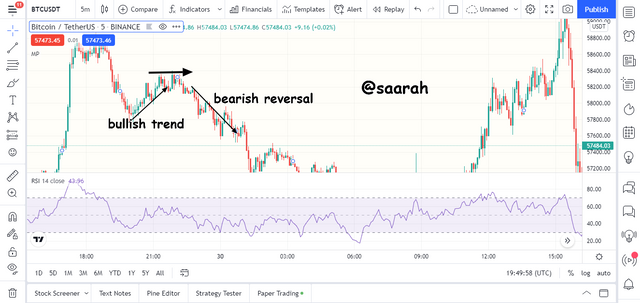
The market constantly shifts between these two trends and that is what are called reversals. When the market shifts from a downtrend to uptrend we call it a bullish reversal and when the market shifts from uptrend to downtrend we call it a bearish reversal.
Why the reversals happen?
The reversals are the representation of the transaction volume and the presence of buyers and sellers. When there are more sellers in the market, they drive the price lower we and we see a downtrend. When there are more buyers, they take the price high and we see an uptrend.
At the end of the downtrend when sellers lose control and buyers began to enter, we see a bullish reversal and at the end of the uptrend when the sellers are taking control, we see a bearish reversal.
What is the benefit of identifying reversal patterns in the Market?
The right identification of trend reversals tells us when the trends are changing and thus help us in placing our orders at the right time. Otherwise, if you do not take the reversal patterns into consideration you may place a sell order at the time of the market when it is about to go high and you will trade in complete loss.
On the contrary if you trade using trend reversals you can place early bids that can be very profitable. Trend is your only friend and if you place orders at exhausting trends, you are opposing the trend and you can never win this game.

b) How can a fake reversal signal be avoided in the market? (Screenshot needed)?
Trend reversal patterns are normally studied directly and traded directly on the charts. But sometimes there may be fake reversal patterns or patterns that may appear like reversals but the market pressure may not be sufficient to support them and since you cannot know about selling and buying pressure through the simple chart you may suffer a lot.
In order to identify fake signals experience traders often use indicators. These indicators help us confirm the chart patterns and place right selling and buying bids. There are many indicators that you can use to confirm trend reversal patterns but my favorite is the RSI.
It is very easy to understand. The RSI line help us identify the overbought and oversold conditions. The market often reverses after toughing these extremes. When the RSI reaches an overbought condition there are high chances of a bearish reversal and if it is trading in an oversold condition there are high chances of the bullish reversal.
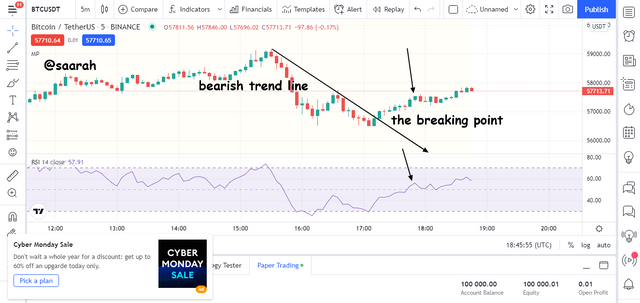
Chart: BTC/USDT
Time frame: 5m
In the chart above we see the price line breaking the bearish trend line. This in most cases is an indication for a trend reversal but the RSI line did not move appreciably towards the overbought region indicating that it may be a fake or weak reversal and so not very beneficial. Trades placed at this point would be risky and non-profitable.
Question# 2
Give a detailed explanation on the following Trend reversal identification and back up your explanation using the original chart. Do this for both bullish and bearish trends (Screenshots required)??
There are various strategies and chart patterns that we use to identify trend reversals such as the:
a) Break of market Structure.
We have different market structures during a bearish and bullish trend that is an identification of the ongoing trend. When the market invalidates that market structure this may be an indication of a reversal such a shift in the market structure may be called as the market break.
Bullish market break
The bullish market structure shows higher highs and higher lows. This means when the bullish trend is to continue the next high will always be higher than the previous and the new low will be higher than the previous low. The current closing price will be greater than the previous.
If a bullish market structure shows a high that is lower than the previous and a low that is lower than the previous this is said to be a bullish market break this indicates that sellers are increasing and taking control.
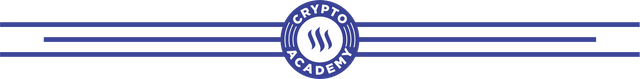
Bearish market Break
The bearish market structure shows lower highs and lower lows. This means when the bearish trend is to continue the next high will always be lower than the previous and the new low will be lower than the previous low. The current closing price will be lower than the previous.
If a bearish market structure shows a high that is higher than the previous and a low that is higher than the previous this is said to be a bearish market break and this indicates that buyers are increasing and taking control. It can be seen in the BTC/USDT chart below.
b) Break of Trendline.
Trend lines are drawn to show the direction of the ongoing trend. When they represent a continuing uptrend, they tend to behave like a floor and a dynamic resistance the price renounces from this level and in case of downtrend it acts a roof and a dynamic resistance.
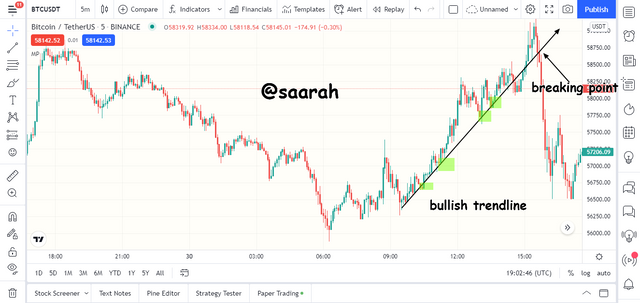
Bullish trend line Break
A bullish trend line is formed by connecting two higher lows and that is why it acts as a support. The price line rebounces form this level many times and it is only broken in case of a change in trading volume. When the price line breaks the bullish trend line a bearish reversal can be seen often. This indicates an increase in the number of sellers and thus selling pressure to decrease the price.
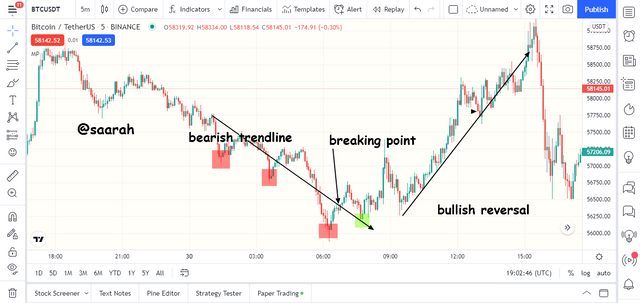
Bearish trend line Break
A bearish trend line is formed by connecting to highs and that is why it acts as a dynamic resistance. The price line rebounces form this level many times and it is only broken in case of a change in trading volume. When the price line breaks the bearish trend line a bullish reversal can be seen often. This indicates that an increase in buying pressure and thus buyers take control to take price higher.
c) Divergence
Sometimes when using indicators, we can locate reversal patterns by a contention and confluence in the price action and the indicators. These are called divergences.
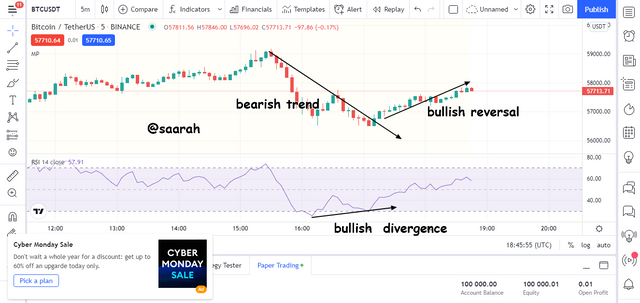
Bullish divergences
During a bullish divergence the price action can be seen making lower highs or lower lows whereas the indicator can be seen making higher lows and higher highs.
This indicates that while the price may still be trading low the bearish trend is losing strength as traders are ending their selling positions to collect their profit and simultaneously buyers are gradually entering the market.
Bearish divergences
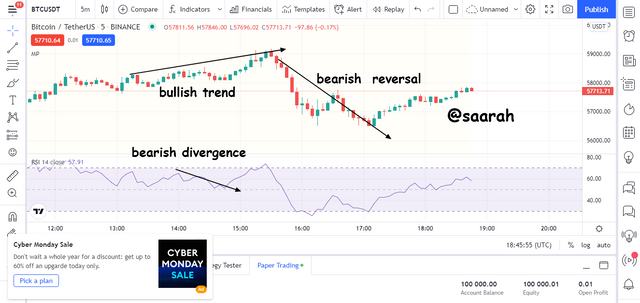
During a bearish divergence the price action can be seen making higher highs or higher lows whereas the indicator can be seen making lower lows and lower highs.
This indicates that while the price may still be trading high the bullish trend is losing strength as traders are ending their buying positions to collect their profit and simultaneously sellers are gradually entering the market.
d) Double top and Double bottom
the double top and double bottom patterns and trend termination pattern. This indicate that the price after retracement could not reach to a new high and low respectively and thus the trend might not continue forward.
Double tops
As the name shows the double top pattern is referred to a pattern in which the two consecutive tops or highs are formed at the same level. This indicates that the price failed to rise higher than where it closed previously.
This means that the buying pressure is not enough to support a further high in the price. This indicates that the bullish trend is weakening and a bearish reversal is about to happen. This a good reversal pattern unless the second top is formed higher than previous.
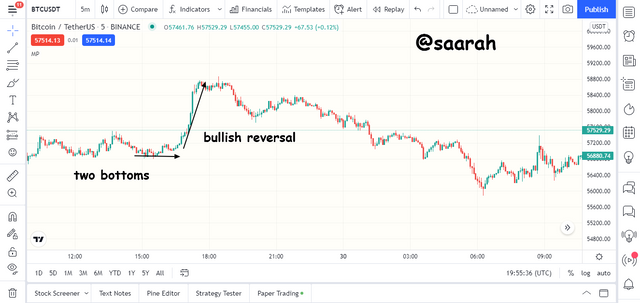
Double bottoms
As the name shows the double bottom pattern is referred to a pattern in which the two consecutive bottoms or lows are formed at the same level. This indicates that the price failed to dip lower than where it closed previously.
This means that the selling pressure is not enough to support a further decrease in the price. This indicates that the bearish trend is weakening and a bullish reversal is about to happen. This a good reversal pattern unless the second bottom is formed lower than previous.
Question# 3
Place a demo trade using any crypto trading platform and enter a buy or sell position using any of the above mentioned trend reversal/continuation pattern?
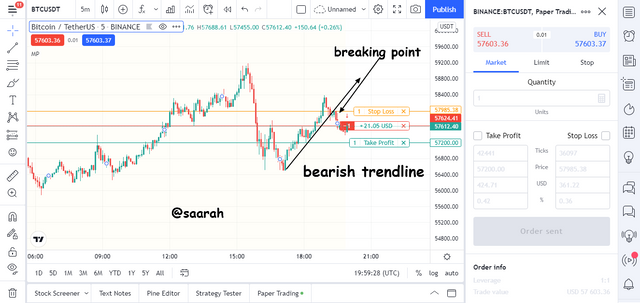
I traded using the following criteria
- Identify the ongoing trend
- Locate a trend reversal or continuation pattern
I saw a bullish trend which was exhausting as the price lien broke the bearish trend line which was acting as a dynamic support. This indicated that the bullish trend was exhausted. The stop loss and take profit were place in the ratio 1:1. The trade went well.
Conclusion:
Trading the reversal patterns is a very common strategy. For this strategy you need to identify early trend reversals. These post very useful as it describes the very important trend reversal patterns such as the market structure break, the formation of two bottoms and two tops. These strategies when coupled with indicators provide great trade setups. In this post I tried to describe every trend reversal strategy in detail.
Note :
All the images of the have been taken from the tradingview.com
CC:
@reminiscence01
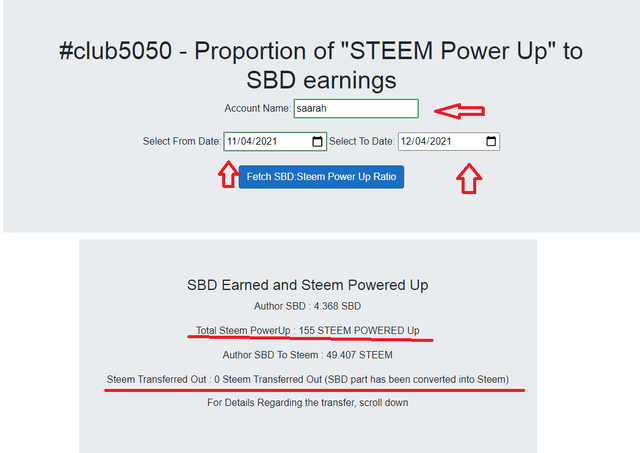
My Transferred History #club5050
Hello @saarah , I’m glad you participated in the 3rd week Season 5 of the Beginner’s class at the Steemit Crypto Academy. Your grades in this task are as follows:
Observations:
This is not a clear example of a divergence.
Recommendation / Feedback:
Thank you for participating in this homework task.