Crypto Academy / Season 4 / Week 1 / Trading with Strong, Weak and Gap Levels - Homework Post for Professor @allbert
Hello everybody, Hope you all are fine and in good health!
My this post is a Homework Task assigned by professor @allbert which is about Trading with Strong, Weak and Gap Levels

Q. 1)
There are generally two areas in the market which are formed due to the liquidity of an asset. These are support and resistance levels. A support area is formed when consecutive lows are joined together with the help of a line. In short before an uptrend reversal the price rests at a level for a while that level forms a support. On the contrary a resistance level is seen as the roof of the market that is formed when the highs are joined.
Strong levels:
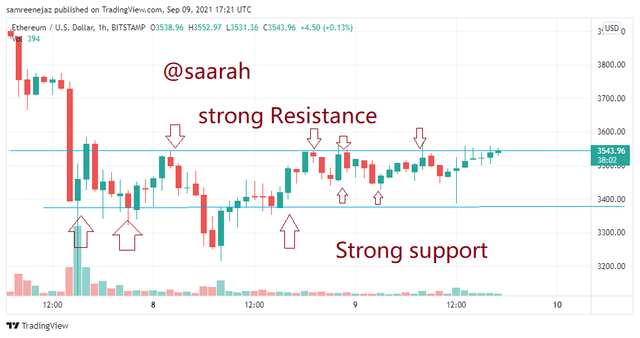
When the market rests again and again at the same level such a price level is termed to be a strong level. For example, a strong resistance level is a level which the price touches but bounces back from, the same is the case with a strong support line. The price line is repelled after touching a strong level and that happens at least twice. To find a strong line see for the support or resistance from which the price has repelled several times.
Reason for their occurrence:
They are favorite price zones and are formed due to the large number of pending buy or sell orders at the point.
Weak levels:
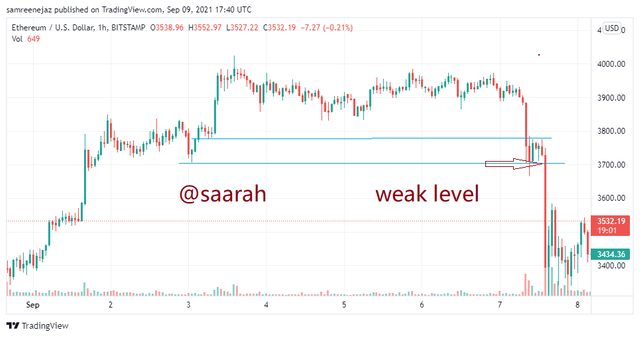
The weak level is the support or resistance line that is not very reliable; it is broken immediately. It is seen as a level which the market touches but to break it.
Reason for the occurrence:
The buy and sell orders at the price are not significant and thus it is easily broken
It is to be understood that the strength of the support and resistance line depend on the number of buy and sell orders at these levels.

Q. 2)
A gap is a space that is left between two candles. The two candles can both be bearish, bullish or one bearish and the other bullish. These gaps are 0ften hard to interpret. There are basically three types of gaps seen in the trading charts. These breakaway gaps, exhaustion gaps, and runaway gaps. These types will be discussed in the next question.
Reason for the occurrence:
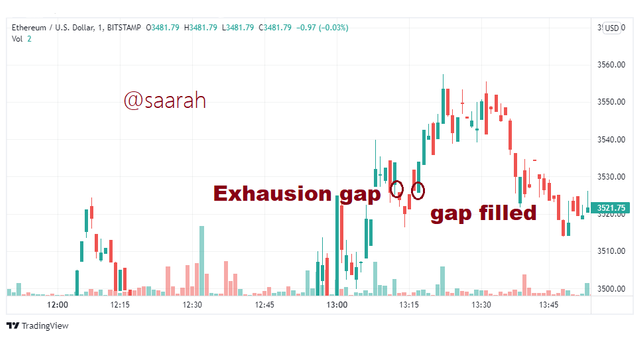
The gaps result due to volatility in the price of the underlying asset. The sudden fluctuations in the price cause the successive candle to form at a distance from the previous candle at the new price causing a space to be formed between the two candles. As the price jumps from a price level to a new level certain price levels are omitted which are later filled in the next swing.
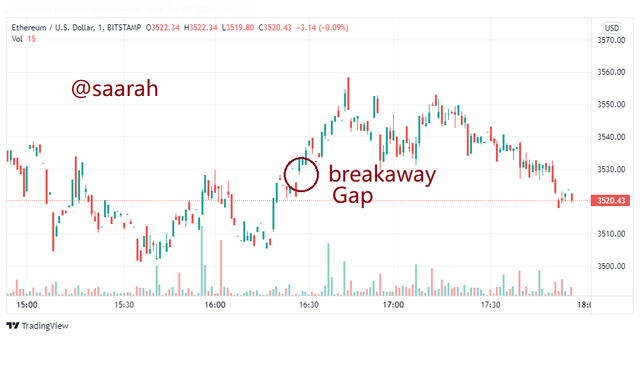
As we can see in the screenshot below
Chart: ETH/USDT time frame: 1min

Q. 3)
Types of Gap
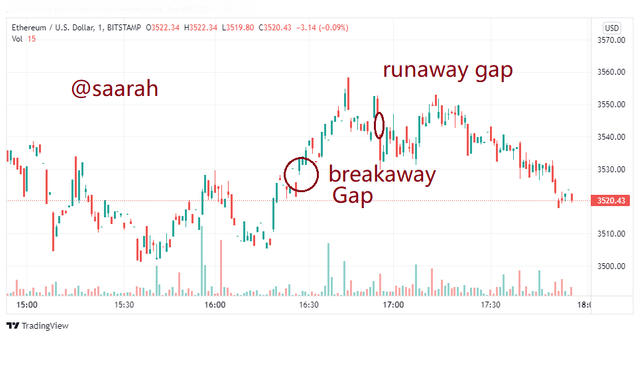
The breakaway gap:
The breakaway gap indicates a shift in the trend and is often the representation of a strong support or resistance. Traders often use it for pinpointing the right buy and sell signals.
Runaway gap:
These gaps are often seen inside a trend and the trend continues in the same direction after them. They are often hard to locate.
Exhaustion gap:
Most traders confuse it with a runaway gap. It is found at the end of trend and it is filled in the nest swing therefore in trading the traders trade opposite to it.
Q. 4)
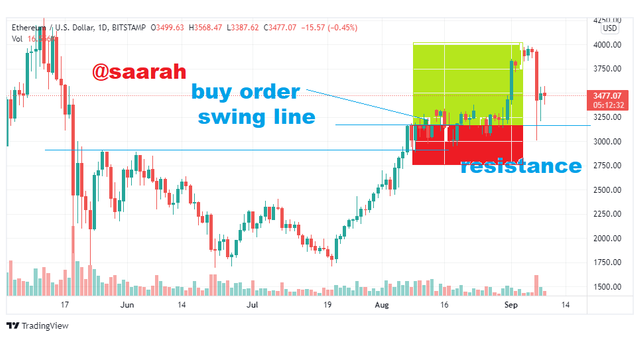
In trading at support and resistance levels we look for the swing levels. In the above chart swing levels are indicated by a horizontal line.
As the price broke the resistance level and made a swing it made a few bullish candles respecting the resistance line then it continued to move upward.
The buy order was placed as soon as the previous swing level was achieved. The stop loss and take profit were in the ratio 1:2.
Q. 5)
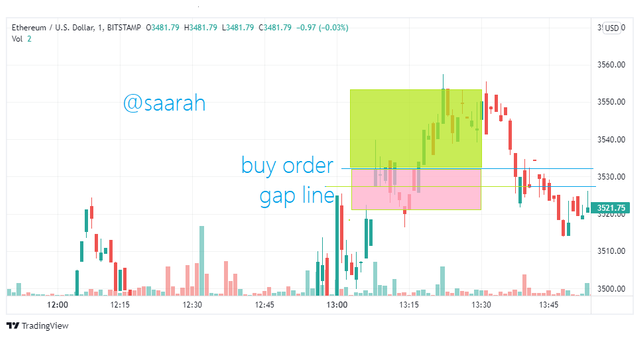
While trading at the gaps we draw a gap line below the successive candle. The entry trade is placed at the end of the following long candle.
The stop loss to take profit was kept to 1:2. I could have also placed the order at the next bullish candle when the market had retested the gap line which is acting as a support but the profit was worth the risk.
Conclusion:
It may look very simple but identifying the right resistance and support levels is very important before placing the bids. The simplicity of this set-up is the fact that many traders use it for trading. The gaps strategy is also reliable if the right gaps have been identified. But it is always recommended to combine them with other indicators, most importantly RSI.