Crypto Academy S4 | Intermediate Level Course for Week 8 : [How to Trade Cryptocurrencies Profitably Using TD Sequential ] by @reddileep
Hello everybody, Hope you all are fine and in good health!
My this post is a Homework Task assigned by professor @reddileep which is about In-depth Study of How to Trade Cryptocurrencies Profitably Using TD Sequential


Define TD Sequential Indicator in your own words.
From what I studied on the internet these indicators work well with bar or candle charts only. With the help of these indicators, a large number of traders can identify the entry and exit points of the trade. One can understand how strong the present trend of the price of the market is with TD sequential Indicator. The indicator is based on the number strategy which I’ll be discussing in the second question.
One can use this indicator in a way we apply other indicators on popular platforms like trading view. It is said the indicator works well with higher time frame charts however there is no limitation to its use.
Explain the Psychology behind TD Sequential. (Screenshots required)
PSYCHOLOGY BEHIND TD SEQUENTIAL
As said earlier this indicator is used to identify trend reversal which is done with the use of its special numerical strategy. The TD sequential indicator has different phases however I’ll be discussing the common most phase which is the TD SETUP phase. Which is further divided into two setups i.e. TD buy set up and TD sell set up.
Firstly I’ll be explaining what this setup is about, as said numerical strategy the TD setup included 9 consecutive candles in which the close of the candle or bar is either higher or lower than the close of the fourth candle present earlier than the TD set up candles. The pattern is followed continuously until the 9 candles are formed such a set of 9 candles is called TD setup.
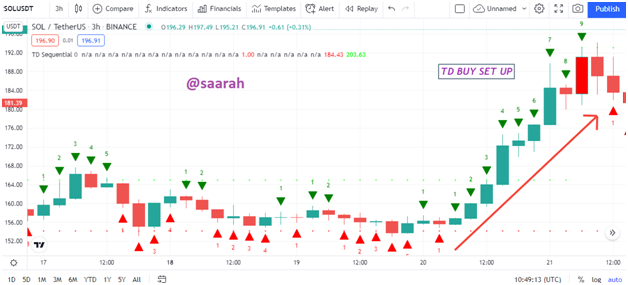
TD BUY SETUP
I’ll be using the help of the chart of SOLUSDT below to explain the TD buy setup. We have understood TD set up earlier in this question however to know when it’s TD setup we see whether the close of TD 9 setup candle is higher or lower than four candles before them. It is said to be TD buy setup if the close of bar or candle is lower than the fourth candle before each candle of TD setup.
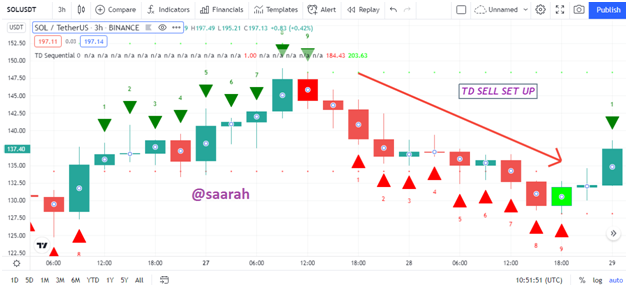
TD SELL SETUP
We already discussed the TD set up in the above paragraph however for being specific with sell setup, it is said to be TD sell up when the close of each TD setup candle is higher than the fourth candle before it. In the screenshot below I have explained the TD sell setup of the BTCUSD chart
Apart from this TD setup, there are other phases of this indicator too such as TD countdown which is the same as TD setup but includes 13 candles and the candle we use for consideration is the second candle before each TD countdown candle.
Explain the TD Setup during a bullish and a bearish market. (Screenshots required)
The understanding of TD setup psychology will make it a lot easier to understand this setup in a bullish and bearish market.
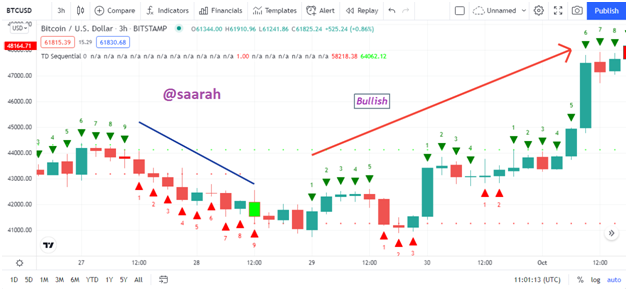
Bullish Market
We can understand TD's setup in the bullish market with the help of the chart below of the BTCUSD trading pair. We know the bullish market arises after the downtrend of price in most cases. It can be seen in the screenshot below the TD buy set up candles was observed when the market had been in a downtrend. If we remember the purpose of this indicator we’d know it helps to detect trend reversal so technically the market was expected to turn bearish after the TD setup completion which the market did. As can be seen, I have marked the bullish movement of the market.
BEARISH MARKET
Contrary to the bullish market a bearish trend is expected after the price had been in an uptrend for some time hence I’ll be explaining the TD setup in a bearish market through the chart below of SOLUSD. It can be seen the TD buy setup candles were observed in a bullish market and as the indicator predicts the trend reversal we can see upon completion of TD setup the market switched to bearish.
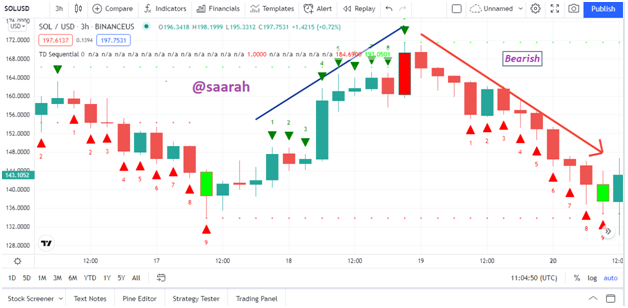
However, the market doesn't need to always reverse its direction sometimes it can further continue the similar trend with higher volume hence traders here mostly wait for one or two candles before making their decisions.
Graphically explain how to identify a trend reversal using TD Sequential Indicator in a chart. (Screenshots required)
I’ll be using the SOLUSDT chart to explain how we can identify the trend reversal using TD sequential indicator graphically which can be seen below
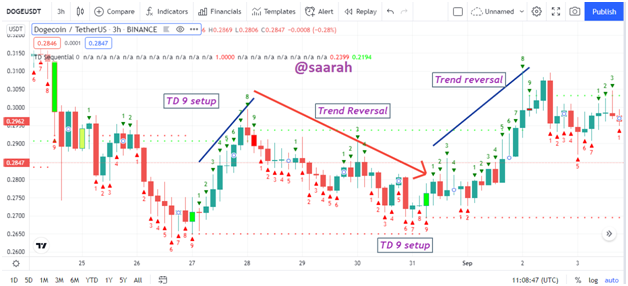
In the screenshot above the place where I have marked the first TD 9 Setup (although there’s one before that too I’ll be using only marked part in my explanation), it can be seen the TD setup was plotted in Uptrend of price since the indicator is aimed for identifying trend reversal hence the trend reversal after an uptrend is a downtrend. We can see in the screenshot above upon completion of TD 9 setup in an uptrend the asset price met trend reversal in a downward direction. However, after some time the TD setup candles were observed again in the downtrend. Following the strategy, the price trend upon completion of TD setup reversed and the price movement begin to move in an upward direction. Hence the trend reversed again.
Hence with the above-mentioned strategy, we can identify the trend reversal using the TD sequential indicator.
Using the knowledge gained from previous lessons, do a better Technical Analysis combining TD Sequential Indicator and make a real purchase of a coin at a point in which TD 9 or 8 count occurs. Then sell it before the next resistance line. (You should demonstrate all the relevant details including entry point, exit point, resistance lines, support lines, or any other trading pattern such as Double bottom, Falling wedge, and Inverse Head and Shoulders patterns.
For this, I will be doing a technical analysis of the SOLUSD trading pair on a trading view chart. It can be seen in the chart below I have marked my entry point on the formation of the TD 9th candle with the market value of 198 USDT. I have my support and resistance level marked too in the chart below by using the TD 9 indicator.
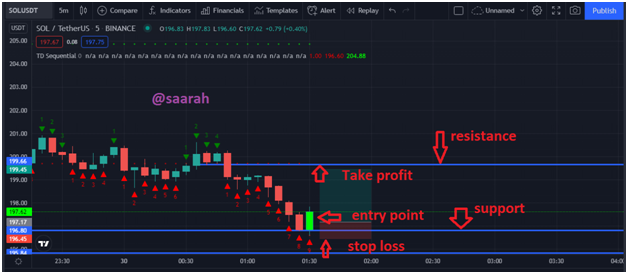
My market entry point can be seen in the screenshot above I have my take profit at the resistance level and stop loss below the support line. Now with the above-mentioned rate I will enter my Gate Io market and purchase as can be seen in the screenshot below
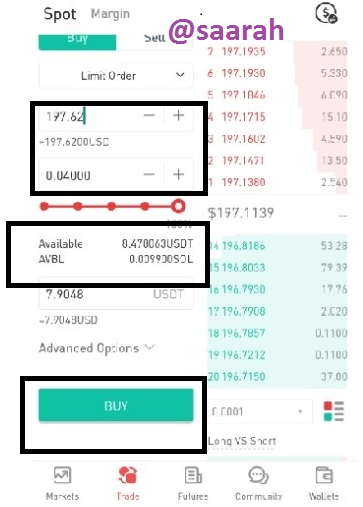
As it can be seen I entered the market at 197 USDT and made a purchase through a limit order.
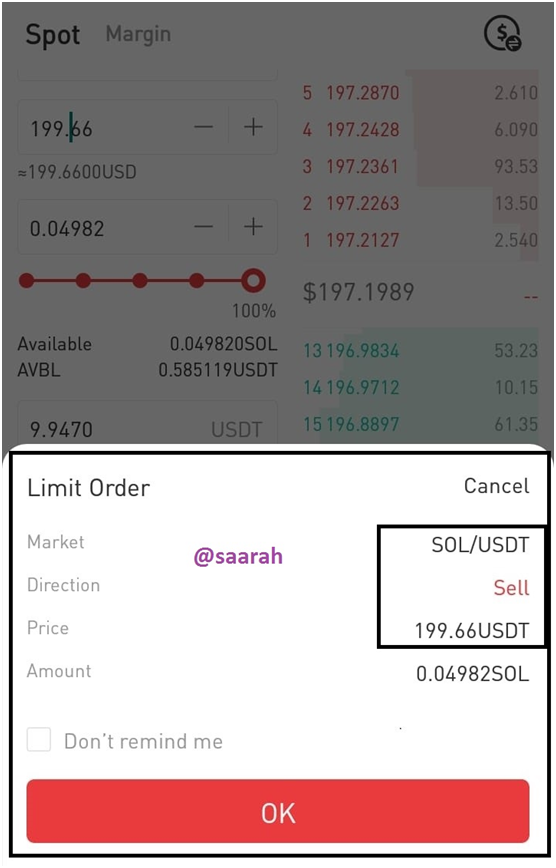
After waiting for some time when the current price met the take profit rate I settled I then sold the assets I purchased in the screenshot below you can see the screenshot of the limit order I placed to sell my coins at the desired price which is 199.66 USDT in my case.
Conclusion
TD sequential indicator is one of the remarkable indicators in cryptoanalysis and used by traders for the identification of trend exhaustion and correction. However, as we have learned in different lectures one shouldn’t entirely depend on indicators for trading, or maybe the use of multiple indicators can be helpful.
Lastly, I’d mention gratitude for the professor as it’s due to him we are able to discover another indicator that not only helps us to get done with the task but also helps us as traders too.