PRICE ACTION+PRICE-EVEN TECHNIQUE-CRYPTO ACADEMY/S4W4 HOME-WORK POST FOR @LONONMC21
DEFINE IN YOUR OWN WORDS WHAT PRICE ACTION IS?
Price action can be defined as a process of analyzing Market behavior with the sole motive of knowing entry and exit points. Knowing when to buy and when to sell is very important in trading. The behavior of price in trends is very important considering the medium of your trading be it long term, short term,or medium.
In the technical field, the analysis all round depends on various price informations,but considering price actions we are talking about focussing on price squally, all charts are represented courtesy candle-sticks as you may know.
Price actions has a short term, and a long term all is associated to minutes, days, weeks, months and years, one important thing to note is watching historical level of prices be it maximum or minimum, as price moves breakouts, false signals are inevitable.
DEFINE AND EXPLAIN IN DETAIL WHAT THE "BALANCE POINT" IS WITH AT LEAST ONE EXAMPLE OF IT (USE ONLY YOUR OWN GRAPHICS?
Balance point can be defined as a continuation from the previous candle, or the startup courtesy the previous candle-stick, in here what you need to do is to draw your horizontal lines from the point of the last candle to the point below the uprising candle-stick, looking down at the chart below you will see a clear illustration of that gesture.
This prac illustration how to determine price actions in the market without using any indication for price confirmations, you will agree with me that most Indicators in so many ocassion's goes astray, price may be forming a higher low, while the Indicator showed a lower high. But using the balance point.
you find out that those gestures are prac eradicated, once your horizontal lines are been drawn you then monitor the market movement and thus know your entry and exit points.
CLEARLY DESCRIBE THE STEP BY STEP TO RUN A PRICE ACTION ANALYSIS WITH "BREAK-EVEN"?
I have clearly explained what price actions are at the bigining of this homework, since we now understand that price actions has to do with knowing entry and exit points, but with break even here so many things has to come to fruition like the time-frames, knowing your support and resistance, and your market patterns.
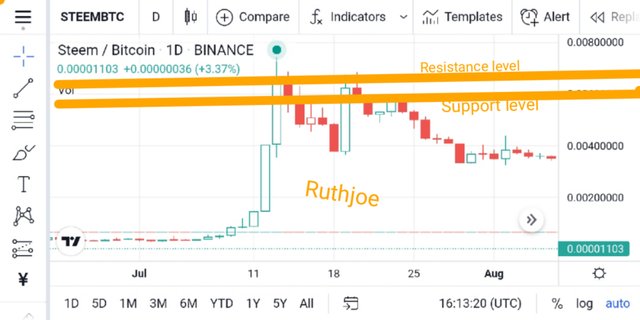
Support and resistance; knowing your support and resistance level helps you know when to place a trade, knowing when to buy and when to sell, it's very important to identify this in order not to experience overbought.
Along the long run, some traders ask this question when do I place my buy entry, here we are not using any indication but with the assistance of our horizontal lines been drawn from the continuation on the last candle-stick will assist you know your support and resistance level.
Choosing time-frame's of your choice; time-frame's are very important in trading as it various from 15mins, 1 hour, 30mins, 15mins, 1day, 1week, 1month, and 1year, using various time-frame's of your choice depends on what you want to execute in the market, for quick trading that is short term trading you need the 15mins, timeframe, price movement here is very flexible, but you can also use a higher timeframe for price confirmations.
Various examples of price actions with Analysis of break even points
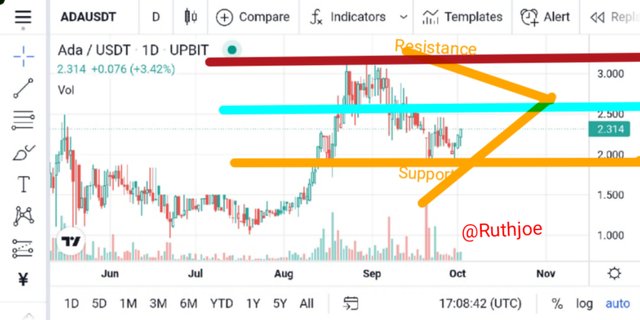
Whenever price gets to the resistance level you don't place a buy what happens at that phase is collection of profits, because price is pretty high out there although later I will illustrate entry and exit points for clear understanding.
WHAT ARE THE ENTRY AND EXIT CRITERIA USING THE BREAK-EVEN PRICE ACTION TECHNIQUE?
Entry and exit criteria's are more like knowing when to buy or sell, knowing when to perform this task are very important, but there are factors that determine entry and exit points one of then is the formations of candle-sticks.
Candle-sticks have a body that opens and closes, also it has a weak, let's say price is in bullish phase getting to the resistance level it starts forming a red candle-stick more like a hanging man, with red long wick quickly know that price will be going downtrend at this point you enter for a buy.
Before you execute your buy order you are supposed to conduct proper technical Analysis about the coin you want to buy, and the candle that forms the balance point, when a clear break happens then a clear break-even point will then give an overview on when to enter for a buy.
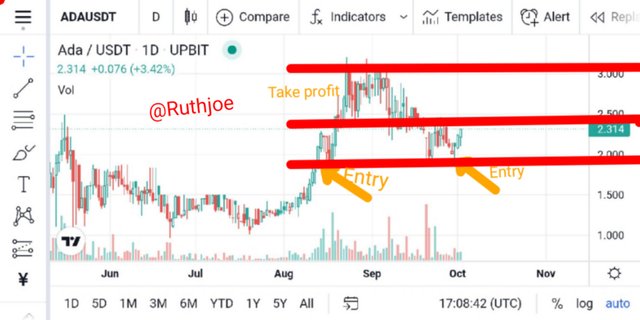
Since break-even has to do with entry and exit points from the chart below I illustrated my entry points but one thing you need to know is spotting your take profit-zone this is perhaps very important as well as spotting your stop loss, your stop loss should be set at below the candle-stick at least 2%, and 2% upwards making it ratio of 2:2.
WHAT TYPE OF ANALYSIS IS MORE EFFECTIVE PRICE ACTION OR THE USE OF TECHNICAL INDICATORS?
For me I think the use of technical Indicator is the best for me, honestly this is my personal opinion, when using technical Indicators to confirm price movement it goes in-line with the oscillator been used as trend moves the oscillator been used moves with it although not in all ocassion shall.
Whenever I make use of technical Indicator I use more than two, for me to agree to what the first Indicator gives to me it has to correspond to the other two, there are lots of price fluctuations in the market so whenever the three Indicator corresponds then I will then go ahead to spot my buy or sell, take profit and all the rest.
Using technical Indicator helps you to carry out more technical Analysis about price movement in the market, for example the use of RSI, you will quickly know when price is in downtrend or Uptrend, and you will be able to know the figure the RSI, will get before before making your buy entry. So for me I think the use of technical Indicator is the best.
CONCLUSION
From my homework task I was able to highlight that price action is process of Analyzing market behavior with the simple motive of knowing entry and exit point, knowing when to buy and when to sell precisely, price actions depends on the nature of trades that you want to execute be it short, or long term trading.
I also talked aboutbalance point, which I defined it as the continuation from the previous candle-stick, or the set-up courtes the previous candle-stick, what you need is to draw a horizontal lines by so doing you can determine the phase of the market and Analyze the trend to know your entry and exit criteria.
I also hinted on the use of technical Analysis as the best for me, with the sole reason/motive that it moves in conjunction with price movement, and for proper confirmation you need spot more than one technical Indicator and they must move and work together to achieve one result by so doing you can spot you buy or sell. Thank you very much professor @lenonmc21, you really explained well, many thanks to you.