CRYPTO TRADING STRATEGY WITH TRIANGULAR MOVING AVERAGE (TRIMA) INDICATOR CRYPTO ACADEMY S6W4 HOME-WORK POST FOR @FREDQUANTUM.

Introduction.

Each time we trade we gain idea regarding how market goes, I still believe the narrative that market moves in circle's/Zig-zag form by this you can detec the phase of the market by knowing your strategic support and resistance levels all round in the market.
Trading comes in various facet's which are seen by overall wideness from forex, volatility, and crypto trading for me I still go with that narrative that crypto Trading is the most volatile yes most may not believe but that's the real fact.
Before placing a trade you need input various things to making sure that your trade comes out in a successful fashion, first you need know when market is in Overbought or Oversold region at this point the use of Indicators comes to fruition.
Indicator helps you know when to buy and sell in the market but for me I don't trust Indicators 100% because most of then lags behind when market trends, at this point we shall talk about a very popular Indicator called the Triangular moving average Indicator (TRIMA).
What is your understanding of the TRIMA indicator?
Trima Indicator is more like the moving average very similar in nature, the most interesting aspect of this Indicator is that it shows the main price of the assets in question courtesy various data points in here we are talking about various price bars.
One major objective of the triangular moving average is that it helps in smothening price data points.when this officially occur's a line will be seen on the chart interphase but the reaction isn't as smart as the SMA.
When the market is very volatile or ranging this Indicator won't react emmensely meaning lots of time are required for Trima line to officially change direction most times this Indicator lags behind.
No Indicator works at the maximum all you need do is to restrategize the settings and fit in the Indicator to work in your own favour I will advice to try this Indicator first and see how it works before making Use of it in real account.
Triangular moving average displays the average price of stock over a specified period of time therefore determining bars and various data points.
Double smothening of price data is one motive of the TMA Indicator when this act is been carried out then a line will thus be produced.
in general this Indicator doesn't react fast in a trending or consolidating Market.
Setup a crypto chart with TRIMA. How is the calculation of TRIMA done? Give an illustration. (Screenshots required).
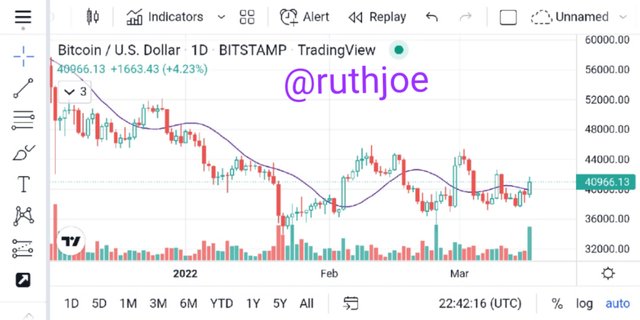
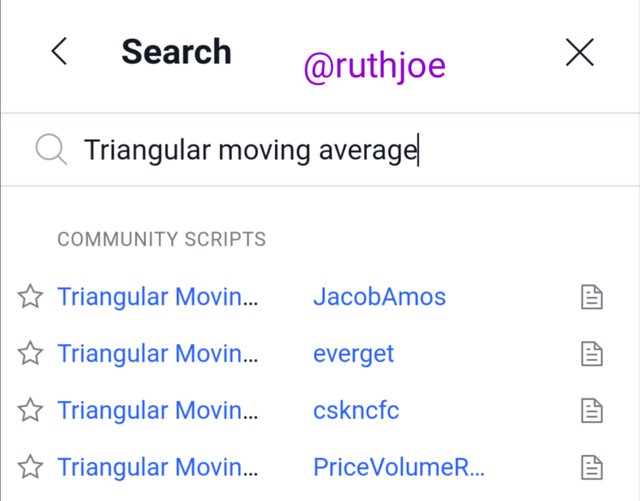
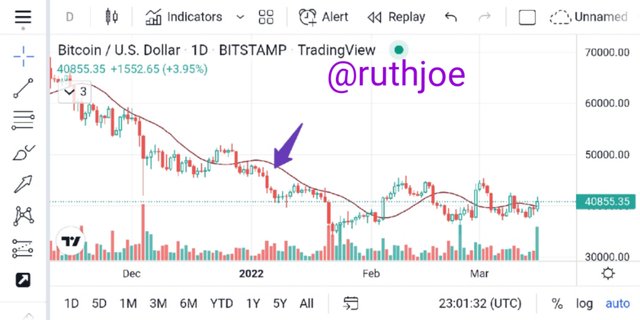
In here before we proceed first I set up a crypto chart involving BTC/USDT at the right hand side I click in the Indicator icon and searched for triangular moving average.
Later it opened and I clicked on it and it was officially added into the chart, as for the colouration I quickly changed it my self to red.
- Immediately I clicked on the Indicator it quickly showed on chart and I exploited the chart platform.
For the calculations first you need get the formular for the SMA then it can be inserted before getting formular for Trima, let's see how it goes
From the onset I stated that this Indicator is a moving average based Indicator that double smothen's the simple moving average this can be represented during trading and when market is booming in general.
This Indicator is an average of an average considering the last N price (P), before then let's proceed to Calculating the SMA after it can be inserted then we get the Trima.
SMA=(P1+P2+P3+P4..............+Pn)/n
In this phase I will collect the average to get Trima values, this is how it works.
Trima=(SMA1+SMA2+SMA3+SMA4+..........SMAn)/.
Another method at which Trima can be written is seen below.
Trima=Sum(SMA values)/n
Looking at all the formulars written you find out that all are been divided by n, which means n plays a vital role in both SMA and Trima n represents number of periods.
Identify uptrend and downtrend market conditions using TRIMA on separate charts.
Identifying uptrend and downtrend using Trima Indicator is very simple first what you need do is to consider the structure and formation of the trending market
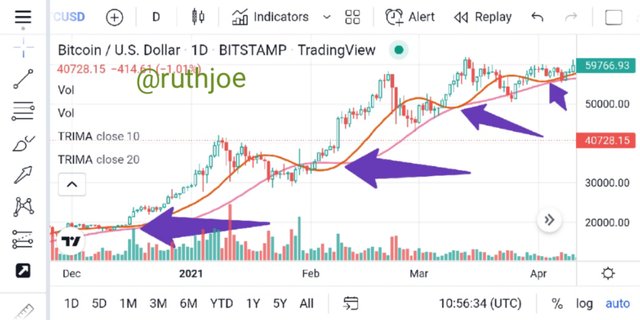
In this operation just as we know Trima Indicator lags behind when market trends so for me I will consider charts patterns in recognising uptrend first.
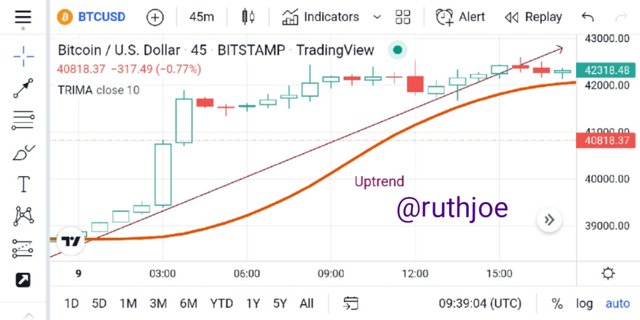
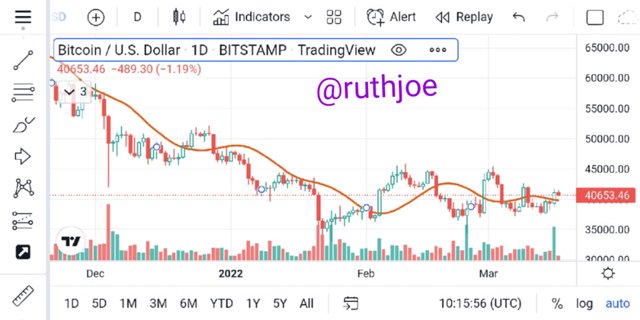
In identifying Uptrend you must consider Support and resistance levels, from the support level we saw a formation of lower-highs and lower-lows.
One interesting thing here is that Trima lime was in line with the formations no divergence was observed.
In the market I will say identifying uptrend Using Trima is very important because it helps you know various points at which entries can be executed in general terms, let's talk about the downtrend phase.
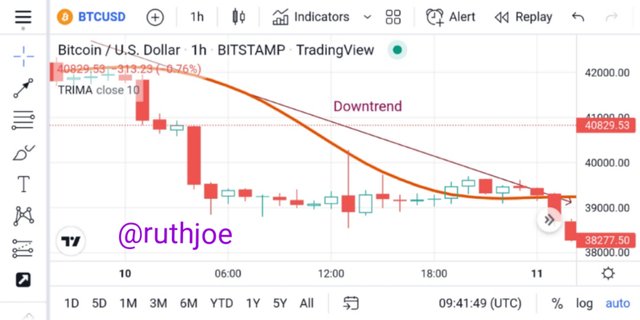
Downtrend formation using Trima usually starts from the resistance level down to the support phase at this point we usually place a sell order from resistance down to support, looking at the Chart we observed a formation of lower-highs and lower-lows.
Whenever we see this type of formations then downtrend is emminent, we should always note that this indicator is slow when market trends so for me I believe in identifying Uptrend and downtrend formation's is the best.
For me no Indicator works 100%, so courtesy that our normal Support and resistance plays a vital role in identifying Uptrend phase and downtrend region in the trending market.
With your knowledge of dynamic support and resistance, show TRIMA acting like one. And show TRIMA movement in a consolidating market. (Screenshots required).
We all know that dynamic Support and resistance are strategic zones in the market where pull back occurs, some will begin to ask the relationship or difference that exists between natural Support and resistance and dynamic Support and resistance.
In our normal Support and resistance the changes that occurs are triggered by price actions, while in dynamic Support and resistance are specifically zones where reversals or pull back occurs over a specific time interval.
Dynamic Support and resistance phases changes as price moves overtime, dynamic Support and resistance applies to other forms of market, including forex, crypto, Volatility etc, in general Dynamics Support and resistance are key courtesy price actions.
This is my overall understanding on dynamic Support and resistance let's apply it to Trima Indicator and see how it can be identified, as we know most trader's use Trima to validate their market entry and exit point's.
Looking at the chart very well you will see a dotted spots in the chart, those points are strategic positions where pull backs will occur.
since I'm able to spot this pull back points in the market then where to place my buy or sell orders are pretty simple for me, in general if you don't know your support and resistance levels then you can't trade effectively.
TRIMA for consolidating Market.
When market consolidates then price will have no definite shape, price will keep ranging going up and down a Linear direction up until there is a breakout from the upper zone to the downside phase of the market.
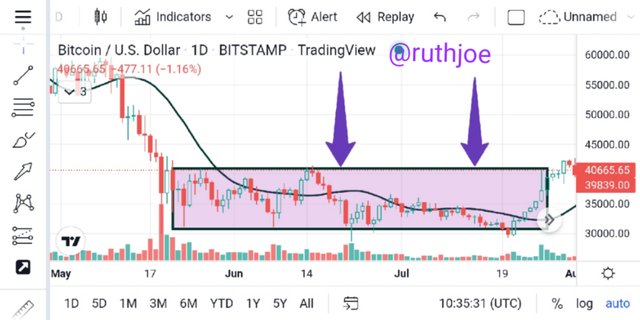
Looking at the ranging market above you will understand how slow Trima Indicator moved this applies to other Indicator's, when market consolidates Indicator seems to misbahave.
Trima Indicator was seen revolving round the consolidation phase of the market like where atom's are revolving round the nucleus, until break-out came to fruition then Trima had a definite shape in its movement.
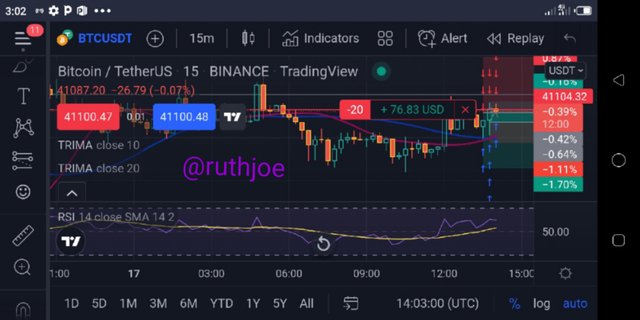
Combine two TRIMAs and indicate how to identify buy/sell positions through crossovers.explain your choice of periods.
When two Indicators are combined together despite the designated period chosen which I think is very optional when croses occurs then there are always signals for either buy or sell let's take Trima Indicator into consideration here.
We all know that this Indicator doesn't react quickly to market and it's basically smothened expecially when there are high volatility and then marke trends overall, market is bond to keep accelerating and after word's Trima can react.
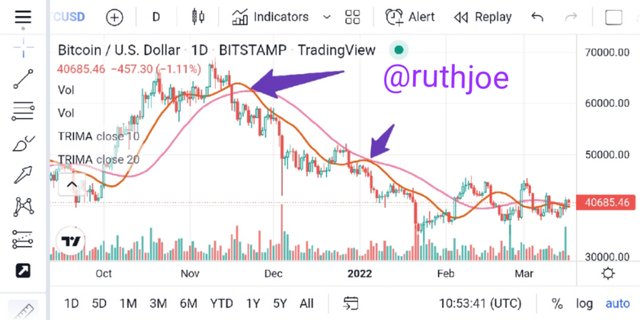
Looking at the chart above I quickly combined two Trima's one having 20, and another 10, periods respectively anyone can choose it's own periods depending on what the individual wants.
Looking at the chart from the resistance phase there was a Bearish crossover from the resistance phase almost two times and this it gave a sell order.
The croses occured almost trice which clearly indicates strong sell option in the market in general, the trend was officially double smothened by Trima Crossovers. Let's quickly look at the bullish crossover's.
From the support level Trima Crossovers took center stage, the bullish crossover's was very strong as the bullish Levels was tested multiple times four times to be precise.
When this happens then we should expect a buy signals always hoping that market will thus continue in it's bullish phase, as we all know market moves in circles most times in Zig-zag form courtesy this reversals are bond to always happens.
What are the conditions that must be satisfied to trade reversals using TRIMA combining RSI? Show the chart analysis.What other momentum indicators can be used to confirm TRIMA crossovers?Show examples on the chart.(Screenshots required)
When two Indicators Combine that is called Confluence trading very ideal just as our people usually say two heads are better than one, we know what Trima Indicator signifies.
RSI relative strength index is basically used to measure the strength of the market knowing it's phase be it overbought and oversold region in the market entirely combining it with Trima will be mind blowing.
Trading reversal using Trima Indicator and RSI is fantastic we know that reversals can occurs in various phases be it in the uptrend phase or in the downtrend phase, when reversals occurs them market is bond to change directions
Before reversals are seen been emminent the below listed criterials must be met, either for bullish or bearish crossover's.
Two Trima's must be added to a chart with different choosed periods (optional) also apply the RSI Indicator to the chart too.
To execute buy order the Trima Indicator must make a cross when the RSI is measured in the oversold region.
You must specific your T.P and S.L zones very important incase market goes against your wish there won't be too much looses.
When the Trima Indicator makes a Bearish cross to the down phase the RSI must measure Overbought to create a sell signal.
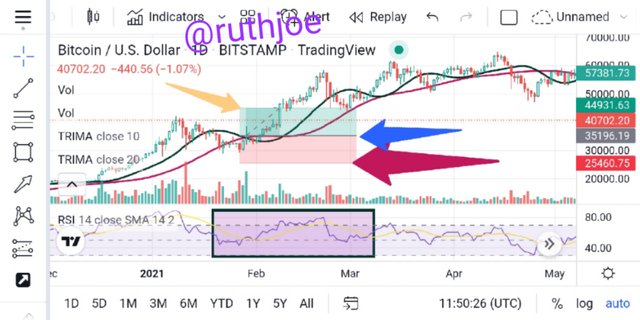
Analysis from the chart you see a clear price actions and marke structures in-conjunction with the basic Indicators been added into the chart, for the bullish reversals RSI actually measured the region before an entry was made.
For the bearish reversals from the resistance level to the support levels was seen vividly as the RSI quickly signified the basics buy and sell positions all round.
Looking at the volume been used you will understand that when price goes bullish volume seems to decrease and when price goes Bearish volume seems to be on an increase, this is another momentum Indicator one can practically use to confirm price movem all round.
Place a Demo and Real trade using the TRIMA reversal trading strategy (combine RSI). Ideally, bullish and bearish reversals. Utilize lower time frames with proper risk management. (Screenshots required)
Just as we know reversals occurs in either from the downtrend or from the Uptrend region in the market, Trix Indicator isn't the fastest as regarding market Trends so I decided to pair it with RSI Indicator.
RSI Indicator will help me measure the phase of the market also it contains two lines when they both makes a crossover it reflects in the market be it a bullish or bearish the results are always pivotal in the market overall.
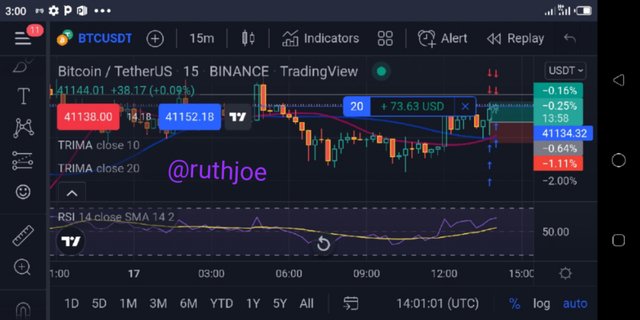
Looking at the chart above you will understand the crossover that occured before price formed higher-highs, this is a framework of a Bullish reversal from the downtrend region to uptrend.
In the chart above price action paid a great attribution to the bullish trend reversal from downtrend to Uptrend, price did a break and retest and tested the previous Support level before going Bullish again.
From the trade placed I was already on profit because I placed a trade at the right time many thanks to Trima Indicator and RSI.
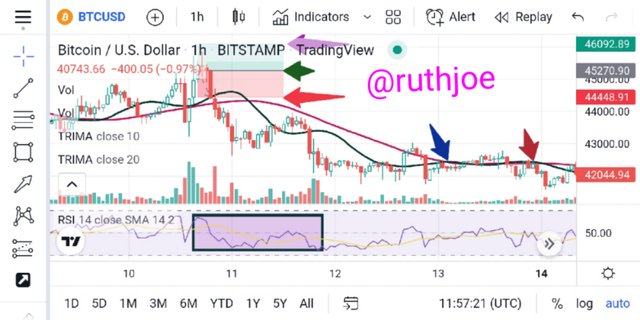
Using lower timeframe I placed a trade trade courtesy bearish reversals from the resistance zones down to the support phase, looking at the RSI it's already at the resistance level is time to sell and the relative strength index already signalling for a sell order.
I placed my trade after all Analysis have been done, looking at the chart above I'm already on profit, in this case I use Trima Indicator and RSI Indicator.
What are the advantages and disadvantages of TRIMA Indicator?
Just as we always say anything that has advantage also have disadvantages too in this case I will highlight various advantage and disadvantages which are seen below.
| Advantages | Disadvantages. |
|---|---|
| Trima Indicator smothen's price data over a specific period of time | Trima Indicator doesn't react quickly courtesy a volatile market. |
| When price moves in cycles Trima Indicator produces a buy or sell orders when croses comes to fruition | in a trending market Trima Indicator always lags behind providing series of divergences. |
| Trima Indicator shows specific number of data points over a period of time | Trima Indicator doesn't show closing price when used in line chart. |
Conclusion.
Trima Indicator can be defined as an indicator that shows the actual price of an assets over a specific period of time this Indicator shows the main price of the assets in question courtesy various data points in here we are talking about various price bars.
Trima Indicator doesn't react quickly when market is trending thus volatile, instead of depending on the Indicator alone I advice you compound formations and market structures in identifying various entry and exit points in the market.
I also hinted on Dynamic Support and resistance where I quickly said that it is a point in the market where pull back occurs.when we talk about consolidation marke in all manner ranges without a clear trend.
Thank you very much for this wonderful lecture presented by you @fredquantum I really appreciate many thanks to you, waiting for your honest review.