Technical Indicators / Crypto Academy / S4W2- Homework Post for @reminiscence01".

Good day steemains and professor @reminiscence01, i welcome you to another week of the steemit crypto academy which is the season 4 week 2. Professor @reminiscence01 has made a nice and well explained lecture and i was able to understand. Below is my homework post.

1a) In your own words, explain Technical indicators and why it is a good technical analysis tool.
Technical indicators are heuristic or pattern-based signals tool that is produced by data points of historic and current price movements, and when setup in a trading chart, it helps traders as part of their technical analysis process to predict future market prices and trends. By calculating previous price movements, traders can use technical indicators to analyze historical data which helps them to predict future price movements. The data points includes previous closing and opening of an asset, amount of candles used, and timeframe considered.
With technical indicators the psychology of the market and the forces of supply and demand that occurred previously can be noticed. Due to this the price is expected to repel or breakout at certain price level in the future and using the technical indicator would help to identify these levels for operational purposes.
Technical indicators are a very important part of a trader's strategy as part of their trading analysis. However, it is advisable that traders shouldn't use technical indicators as a standalone strategy, but as part of their trading analysis with other trading analysis tool to give a good signal confirmation and trading decision. Examples includes Relative Strength Index (RSI), Money Flow Index (MFI), Bollinger Bands (BB), and Stochastic Oscillator.
Why it is a Good Technical Tool
Technical indicators are a guiding tool for traders in the cryptocurrency markets. These are the ways that they serve the traders.
- Prediction: A technical indicator helps traders to predict future prices using historical data.
- Confirmation: Traders can use technical indicators as part of their trading analysis to confirm the signals given by another technical analysis tool.
- Alert: The use of technical indicators allows traders to be alert at the time of entry or exit of the cryptocurrency market.
b) Are technical indicators good for cryptocurrency analysis? Explain your answer.
Technical analysis of a financial asset is a trading discipline used to evaluate investments and to identify good entry and exit points by analyzing statistical trends arranged together from previous trading activity, including price movements and volume.
Technical indicators can be used for cryptocurrency markets because they have historical trading data, such as price, volume, and open interest. The cryptocurrency market is characterized by active traders who seek to gain profits from short-term price movements and the use of technical indicators enables these traders to be profitable.
c) Illustrate how to add indicators on the chart and also how to configure them. (Screenshot needed).
Before a trading indicator can be employed by a trader, it has to be set up on the trading chart. Setting up the indicator involves choosing the proper indicator to be used and configuring it with the right parameters.
In this exercise, I would be giving a step-by-step illustration on how to add an indicator to a chart and how to configure it using the Relative Strength Index (RSI).
These are the step to install the RSI on a trading chart:
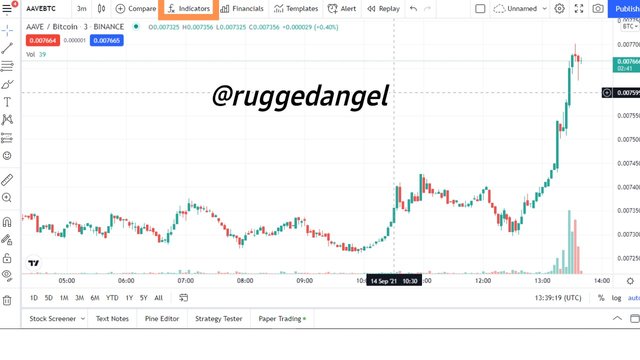
Go to any trading chart that supports crypto currencies. I used tradingview
At the top of the trading interface, click on Indicators.
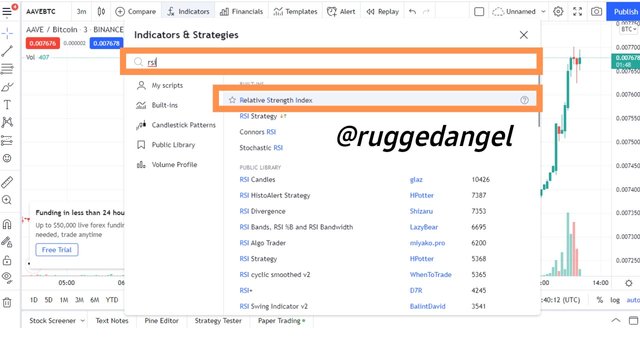
- A drop down interface would display with a search directory. Type the indicator to be installed. I typed RSI, then a list relating to relative strength index would display, choose the one above them all.
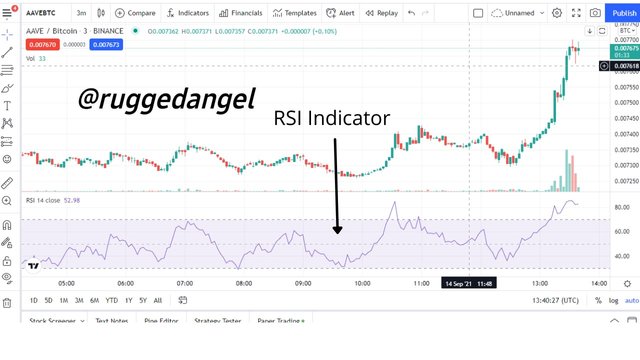
- The RSI indicator is now installed on the trading chart.
To configure the RSI indicator:
- At the top, left corner of the RSI indicator is a watermark showing the details of the indicator. Go to it, then it would highlight more options. Click on the setting options and the settings would display. On it, you would see how to configure the RSI indicator via Inputs, Style, and Visibility. The inputs allow traders to configure the RSI indicator using data points of their choice, and the style allows a trader to change the color and lines used in the indicator.
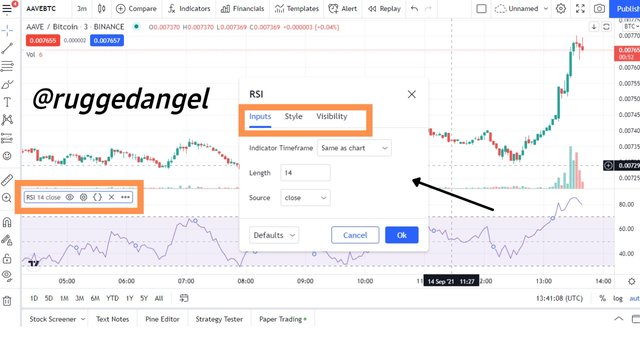
- I left the inputs but configured the style to give a different render of how the RSI indicator would look in my chart. I changed the color of the RSI Line, the Upper Band, the Middle Band, and the Lower Band. I left the background color at default. Then I clicked on Ok
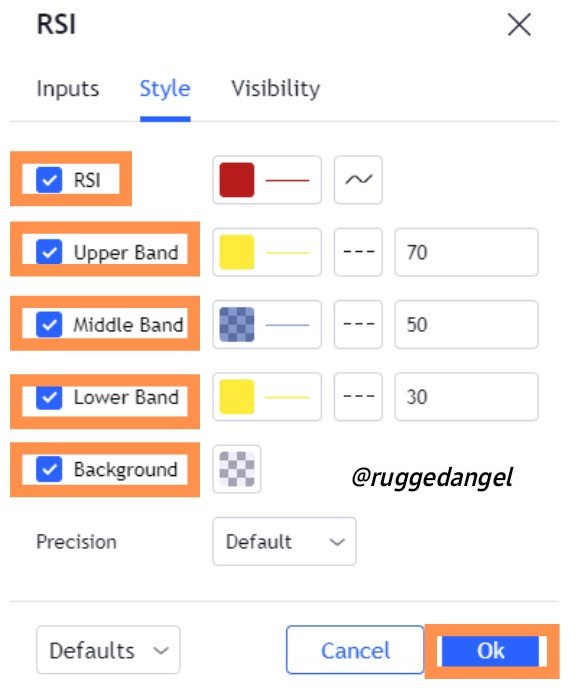
- This is the final outcome of the RSI indicator.
2a) Explain the different categories of Technical indicators and give an example of each category. Also, show the indicators used as an example on your chart. (Screenshot needed).
There are so many technical indicators that a trader can employ as part of his trading process. However, it is necessary to know the type of trading indicator to use depending on the trading style and objectives. The technical indicators are put into different categories, I will be discussing them.
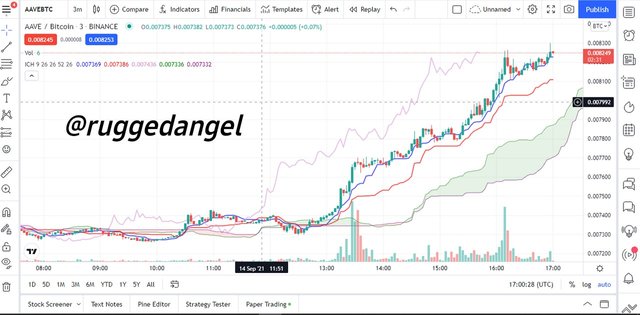
Technical Indicators based on Trends
Trend-based indicators help traders to determine when the movement of the price of a crypto asset is in a Trend or in a Range. Traders use these indicators to have a view of the current market trend. Also, trend-based indicators can also be used to determine the strength or weakness of a trend. When traders get a better perspective of the current trend, it helps them make better decisions on their trading operations.
An example of a trend based indicator is Ichimoku Kinko Hyo.
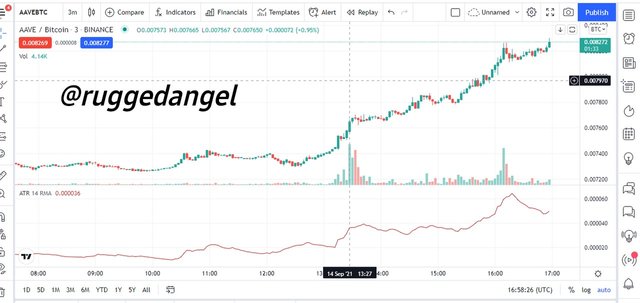
Technical Indicators based on Volatility
Volatility-based indicators are used to measure price swings in the market. The swings could be in an upward direction (upswing) or in a downwards direction (downswing). The crypto market is very volatile and prices of assets can change direction quickly and this is sometimes represented by upswings and downswings of prices. Using a volatility-based indicator helps traders to analyze the upswings and downswings of the price movements. Traders can buy an asset when the price is low or downswing and sell an asset when the price is high or upswing. Traders can also use a volatility-based indicator to determine if the volatility is strong or weak.
An example of a volatility based indicator is Average True Range (ATR).
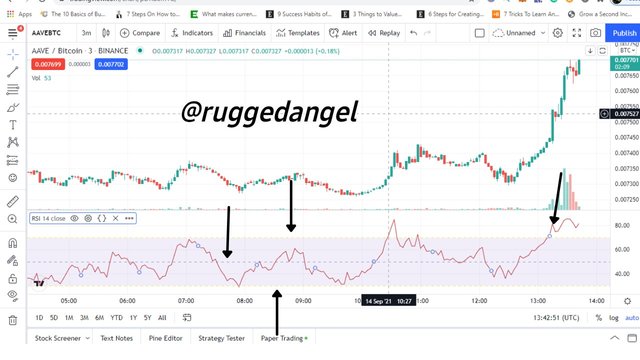
Technical Indicator based on Momentum
These are technical indicators that help traders to analyze how far the price of a crypto asset has gone. They are also known as Oscillators. They give information about the conditions of a crypto asset. It tells when the price of a crypto asset is in an overbought condition and also it tells when the price is in an oversold condition. An asset that is moving down would not continue to move down, due to the forces of demand and supply, at some point traders would start putting money into the asset's market which would put a lot of buying pressure on the asset. Momentum-based indicators are very beneficial as they help traders to know when to take profit whenever a crypto asset is in an overbought region or when to enter the market whenever a crypto asset is in a region.
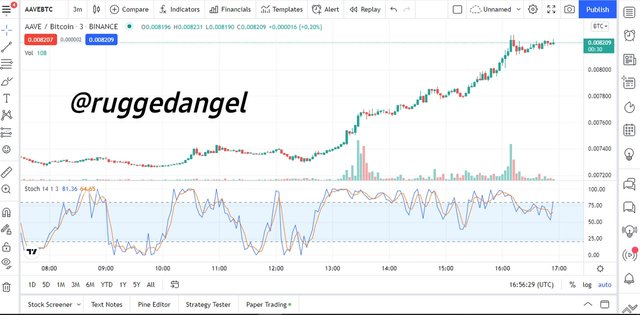
An example of a Momentum based indicator is Stochastic.
b) Briefly explain the reason why indicators are not advisable to be used as a standalone tool for technical analysis.
Technical indicators use data inputs of past and current price or volume activity. Traders use this information to get an idea of the performance of price historically and to try to predict future prices. Using the technical indicators doesn't necessarily give a buy or sell signal; it only gives clues that a trader must interpret to determine an entry or exit point that conforms with his own unique style of trading. Due to this false signals or fakeouts could be given by an independent indicator that can mislead a trader.
To avoid encountering problems related to using technical indicators as a standalone tool when doing analysis, traders should find another indicator that works well with or complement each other. This is done by adding various kinds of indicators to a chart. For instance, a trader could use one momentum indicator (RSI) and one trend indicator (ADX). Because both categories of indicators provide different market interpretations, one may be used as a confirmation of the other.
c) Explain how an investor can increase the success rate of a technical indicator signal.
There is no technical indicator that would guarantee a 100% success rate but traders can use indicators that would work best for them. A trader should know the technical indicator that suits his style. The trader should know that understanding their own style of trading would help them make better trading decisions in conjunction with the technical indicator being used. There are different styles that a trader can seek to emulate, they include Scalpers, Day traders, Swing traders,, and Position traders.
Then a trader should find a 'perfect blend' of his style and the category of technical indicator to be employed. This would aid the trader in making better decisions during trading operations. In addition, a trader should understand the configurations of the technical indicator being employed. This gives the trader a better perspective on the indicator with respect to how it is being applied to the market.
Finally, the trader should always practice good trade management. They should have a range where a stop-loss is placed and where a take-profit is placed, this helps the trader to be efficient in his trading practices and (grow the success rate of a technical indicator signal. source)
Conclusion
The use of technical indicators is very important for traders as it helps them to be alert in their trading operations helps confirm signals and helps traders predict prices of crypto assets.
There are different categories of technical indicators which a trader can employ, this is dependent on how a trader operates in the crypto markets. However, technical indicators don't give accurate signals, so traders should use technical indicators carefully and effectively to help determine entry and exit setups with high probability thus increasing their chances of success.
Thanks for going through my post
Cc: professor @reminiscence01
Written by @ruggedangel
Hello @sapwood
Please sir help me review my homework task.
I have checked it
It's 100% unique.
Please help me out.
Thanks.