Crypto Academy season 4: Intermediate course: week 1. Trading with strong, weak and gap level. Homework post for professor @allbert
As a trader, we should know how to identify strong support and resistance. Firstly, when we talk about support and resistance, what does that mean? Support and resistance is a level in which price have problem to move through or within a level that they bounce off. The support level is found below the price, while the resistance level is found above the price. See example of image below
.png)
1- Graphically, explain the difference between Weak and Strong Levels. (Screenshots required) Explain what happens in the market for these differences to occur.
Source
Strong Levels.
A support line is also called a trend line. Looking at the image below , explains a strong support and resistance.
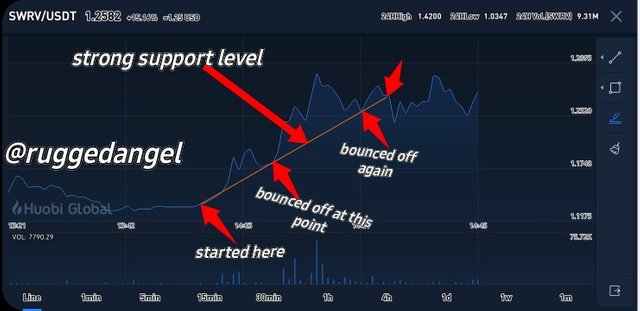
screenshot from huobi exchange
From the gragh above, you can see a typical trend line drawn. This trend line is a line where price several times bounce off. At the image above, it started when the price was moving higher and came back to the support line, then it bounced off and came back right to the support line, then bounced off again to another support line till its stock above. This acts as a strong support. During this trend in the market, this means that the market is bullish, though not stable, expecially at the first image i provided.
Weak Levels.
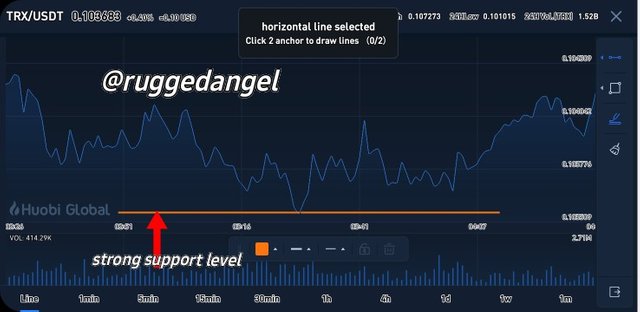
The image below Explains the weak level.
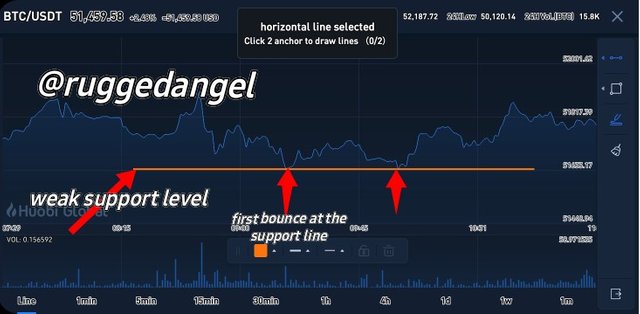
screenshot from huobi exchange
In the strong support which I explained earlier, we noticed that when the trend reaches the strong support level it bounces off very high which show that there is a distinct value or show that buyers perform a good value when buying stocks. Now looking at the weak support level, we can see that there was no distinct value and buyers didn't perform a good enough value to step in. In this case its a weak support level. So with this brief explanation, we can be able to see the differences between the strong and weak support level.
2-Explain what a Gap is. (Required Screenshots) What happens in the market to cause It.
Source
Gaps also means spacing. According to the lecture, a gap is spacing or skipping of definite level or a blank where the opening of a new candle which does not match to the closing of the previous one. Source
Gaps are fairly common in stock trading and in stock market and they usually happen between day to day. A gap is where no trade took place between one moment to the next and it happens fairly frequent on inner day charts from one day to the next day and is less common in a weekly chart or monthly chart. When a particular stock ends the day at a particular level and then starts a fresh level which gives space even though no trade took place. This gaps are commonly from a day to the next day. Gaps can be found in a weekly charts too, but they always took palce over the weekend and its not regular.
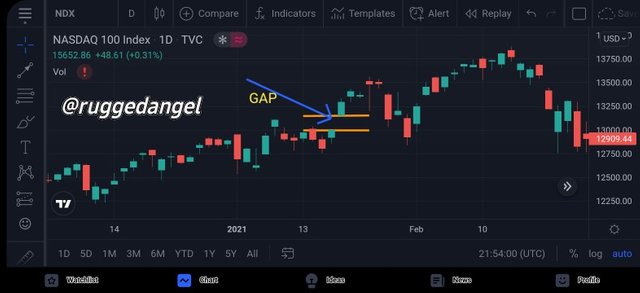
screenshot from tradingview
The reason for gaps is because there is something among the company which they can change e.g Earning report
3- Explain the types of Gap (Screenshots required, it is not allowed to use the same images of the class).
Source
There are four types of chart:
- The common gap
- Breakaway gap
- Runaway gap
- Exhaustion gap
Now let me explain one after thr other.
COMMON GAP
The common gap is mostly caused by poor trading volume and its usually be filled. Common gaps is usually seen on a price chart of a particular stock. Common gaps usually jump from a particular point to another on a chart.
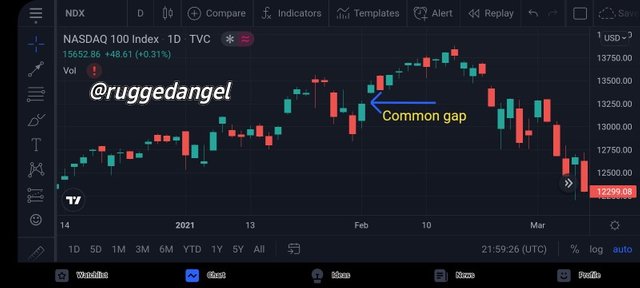
screenshot from tradingview
BREAKAWAY GAP
A Breakaway gap is mostly used in a technical analysis, it shows or indicates a strong price motion via the support and resistance level and it is more relevant than that of common gap. They usually occur in the centre of the trading day and they also have a descending momentum. The breakaway gap is mostly along the support line.
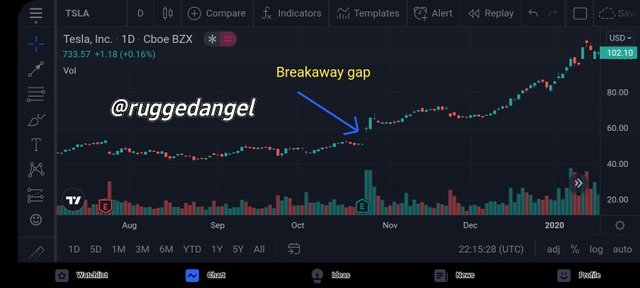
screenshot from tradingview
RUNAWAY GAP
The runaway gap is also similar to breakaway gap. A runaway gap is also can be found on a chart, which happens when trading projects jumps continuous price position. Runaway gap also happens when there is a strong bullish or bearish Movement. It is also a stock price which usually skips to a fresh level. A runaway gap is also created by anything that produce positive opinion. They are mighty whenever they are being brought out of an upward trend.
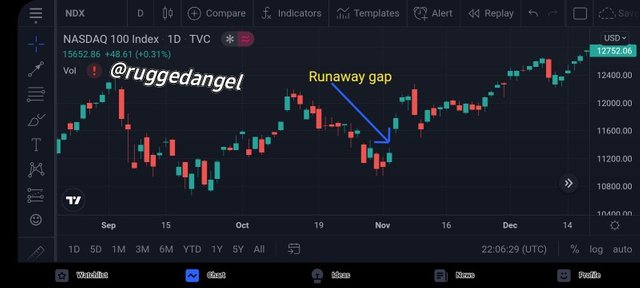
screenshot from tradingview
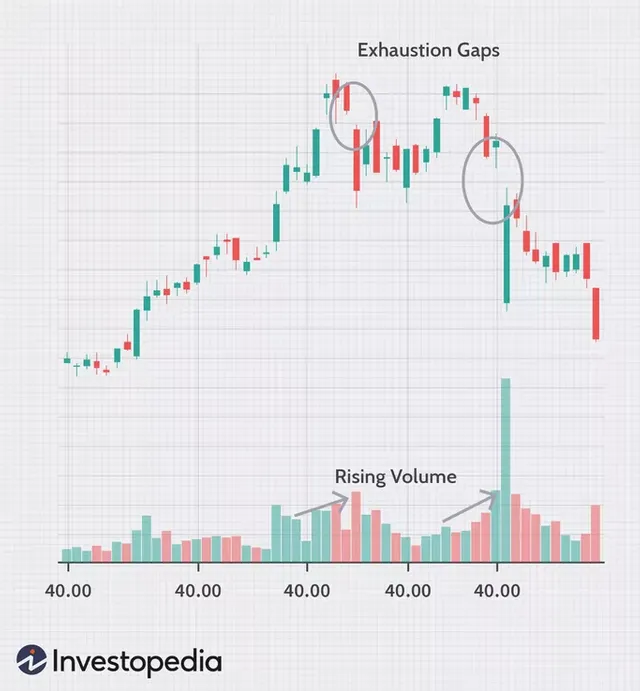
EXHAUSTION GAP
Exhaustion gap can be very risky when you are new to a particular stock market. Though it can be very good for one to trade with, only if you are very careful snd know when to take action. Exhaustion gap occurs when a particular stock rises up continuously, and will later have a serious bearish trend. As a trader, you have to be very careful with this gap.
4- Through a Demo account, perform the (buy/sell) through Strong Supports and resistances. Explain the procedure (Required Screenshots).
Source
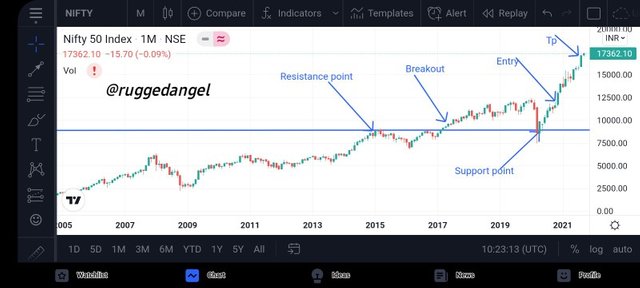
Buy order (Strong level) | screenshot from tradingview
Looking at the chart above, i used NIFTY 1 month chart. At the chart, the resistance point also created a support point. These two point was formed at 8500.00 level. The breakout happens at the point of 9500.00, then the stock keeps bullishing till the market reversed back and start experiencing a bearish trend, which the price fall back at same point where the resistance point was earlier(8500.00) these led to the support point. The market start bullishing again. I took my entry at 12000.00 point, the market keeps going more higher, till it reaches to 17362.10 point, by then i have made some gain and that is where i took profit.
5- Through a Demo account, perform the (buy/sell) through Gaps levels. Explain the procedure (Required Screenshots).
Source
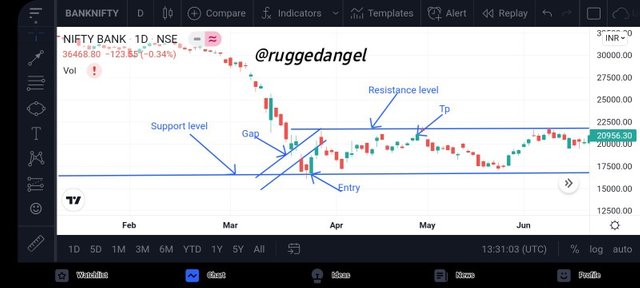
screenshot from tradingview
The graph above is a kind of drift and drive . looking at the chart, we can see the gap level at the point of 18500.00, the market a bearished a little. At the support level, when the market start bullishing , i took my entry at 17500.00 point. The market keeps going up and down till it reaches my target(20956.30) then i took profit.
IN CONCLUSION
Trading with strong, weak and gap level is what every traders suppose to know how to do. Also be able to identify each different type of gaps when trading with gap level. Thanks to professor @allbert for a benefitting lecture.
Cc-
Prof. @allbert
Thanks for going through my post
Your Post has been manually Supported/Up-voted by @steemingdiaries which is a Community & Curation account for Steeming Diaries Community.
Comments, Votes are performed an important role for Community, hence involved with your innovative Comments & Votes on other active users posts.
Community Latest Update: Steeming Diaries CONTEST Of The Month (September 2021) | Steemit FAQ