Crypto Academy Season 3 | Intermediate Course: Crypto Assets and the Random Index (KDJ)|| Homework post for professor @asaj written by @ruggedangel
You all are welcome to the season 3 week 8 of the steemitcryptoacademy homework. Professor @asaj lecture was benefitting to us. I was able to understand the lecture under the topic about Crypto asset and the random index(kdj). Below is my homework post.
1. In your own words define the random index and explain how it is calculated
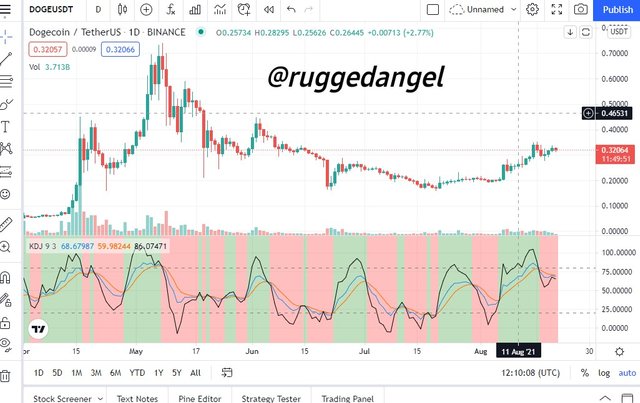
KDJ is a technical indicator that traders and investors alike can use to analyze and predict changes in price movements, price trends and trend reversals. It helps to give clear signals of profitable entry and exist points in the crypto market. KDJ is also known as Random Index. It is an indicator that was created newly relative to other technical indicators. The concept of the KDJ indicator was derived from the Stochastic Oscillator indicator. What made the KDJ indicator different from the Stochastic Oscillator indicator is the extra line that is found in the KDJ indicator called the J line.
KDJ is a representation of three lines in the indicator. The K-line, D-line, and J-line. The K and D lines are similar to the lines found in the Stochastic Oscillator indicator. The K and D line moves up and down in the indicator and hits different values. These values indicate if the crypto asset is over bought or over sold. The values are 80 and 20. When the K and D lines hits 80 and goes above it, the crypto asset is considered to be over bought. Likewise, when the K and D lines hits 20 and goes below it, the crypto asset is considered to be over sold. The J line shows the divergence of the D line from the K line. The J line can go beyond the values of 0 and 100. KDJ indicator is used to measure the momentum and strength of a trend.
How it is Calculated
The KDJ is calculated like the stochastic indicator, but with the addition of the J Line.
1. K line is calculated through the following way:
%K = C - L(pK)/H(pK) - L(pK) x 100%
2. The D line is calculated thus:
%D = M A (%K,p3)
3. The J line is calculated thus:
%J = %K x k + %D x d
where:
- C - the instrument's most recent closing price.
- L(pK) - the instrument's lowest price of the timeframe period
- H(pK) - the instrument's highest price of the timeframe period.
- M A - Moving Average.
- p3 - 3 day period.
2. Is the random index reliable? Explain
I would start by saying no indicator is 100% reliable in giving out true signals all the time. The KDJ (Random Index) indicator help traders and investors to spot the direction of a trend and good entry points and exit points. The KDJ indicator is mainly composed of 3 lines and 2 levels. The J line give an indication of the strength of a trend by means of a divergence from the K and D lines. Also the convergence of the J line with the other lines gives a hint about a change in trend and thus new trading opportunities.
If you align the KDJ indicator with the range of price of the current trend they are more robust. An asset that is moving up will generate a larger price move when buys are triggered and a small price move when sells are triggered. In the same vein a downward moving asset will generate a larger movement when sells are triggered and a small move when a buy triggered. A trader should be careful when employing the indicator. Sometimes a trend could be very strong either up or down and the KDJ indicator is above or below the level lines or even at 100 or 0, don't just sell or buy simply because the indicator shows that the market is in an overbought or oversold condition. The indicator can give unnecessary signal severally before the price finally reverses.
A trader need to exercise a bit of patience for the three lines to converge in order to get clear signals and once they do the market usually moves. It is a lagging indicator and can make short term traders to lose on shorter term trades. During flat markets, the indicator usually gives out fake signals. It is the movement and momentum of the price that it measures and not necessarily the range of the price.
It beneficial to use the KDJ indicator with another indicator like Moving Averages to get a better perspective of the market.
3. How is the random index added to a chart and what are the recommended parameters? (Screenshot required)
Adding the Indicator
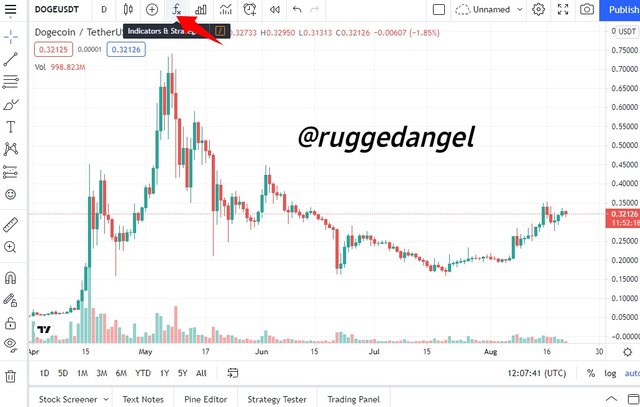
Go to tradingview.com
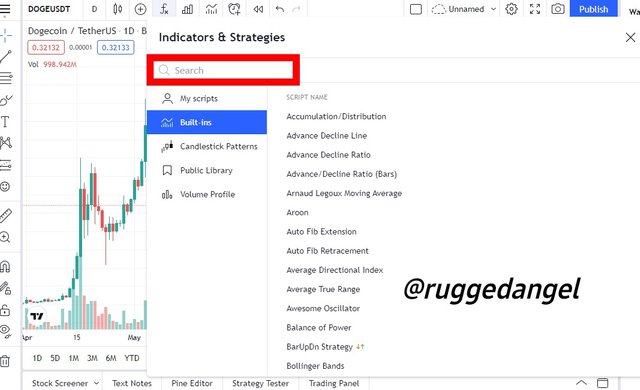
Then go to on indicators & strategies at the top left side of the trading platform and click on it
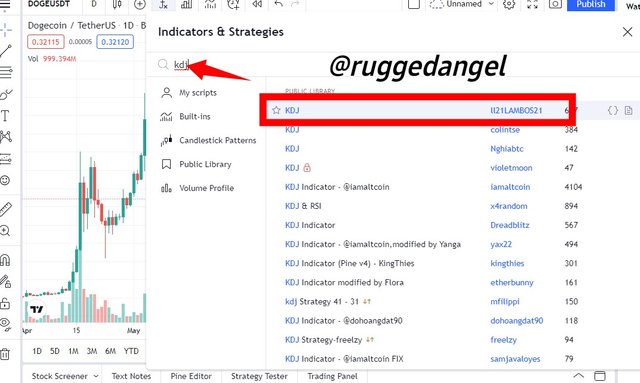
- A search box with a drop down list would appear, type the indicator name
KDJin the box.
- Different types of KDJ indicator would appear, click on the first one on the list.
- The indicator has been added to the trading chart and ready to use.
Parameters
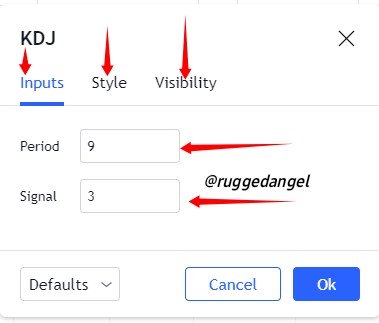
To get the parameters you scroll to the KDJ water mark on the indicator and a display of options would show. Click on the settings option. A display would surface showing Inputs, Style and Visibility.
Inputs
In the input section we have two parameter:
Periods which shows the timeframe that the indicator uses when getting data for the closing price. The default period is 9.
Signal is the lines which the indicator is using. It uses three lines.
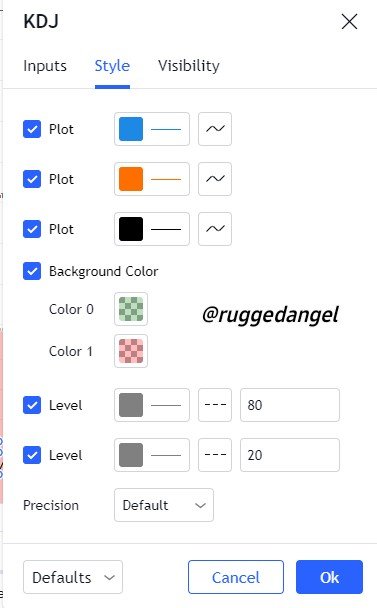
Style
The style section is there to help put clear indication on the different aspects of the indicator. We have:
Plot which shows the color in which the KDJ lines are presented. Blue represents the K line, Orange represents the D line and Black represents the J line.
Background Color which shows the color at the background of the chart. Color0 is green which indicates that the signals are uptrend movement or bullish. Color1 is red which indicates that the signals are in a downtrend movement or bearish.
Level shows the level in which the indicator would give information. The level is both 80 and 20. If the KDJ lines hit 80 level, then the market is said to be overbought and if the KDJ lines hit 20 level, then the market is said to be oversold. They are both in gray color and are represented with broken lines.
4. Differences between KDJ, ADX, and ATR
KDJ (Random Index) Indicator
The KDJ indicator uses 3 lines (K line, D line and J line) and 2 levels (80 and 20) in its indicator. It is similar to stochastic oscillator indicator but with the addition of the J line. It is dependent on the convergence of the J line with the other lines. The KDJ indicator measures the direction in which an asset moves in.
Average Directional Index (ADX)
Average Directional Index ADX is an indicator which helps to show how intense a trend is. Traders use ADX to determine if the price of an asset is trending strongly. The calculations used in ADX are based on the moving average of the expansion in the range of price within a given time period. The plot is a single line with values which ranges from a high of 100 to a low of 0. ADX doesn't give signals based on directions. It only gives the strength of a trend whether up or down. This attributes helps traders to determine the strongest and most profitable trends to trade whether in an up or down market.
ADX gives a clear indication of when a trend is gaining momentum, it doesn't give a signal on which direction the market is moving.
Average True Range (ATR)
Average True Range (ATR) is an indicator which helps to give a measure of market volatility by putting an entire range of an asset price at a certain period. It is typically a 14-day simple moving average of different true range indicators. ATR helps traders to determine a measure of daily volatility of assets by making use of simple calculations. If the ATR is higher then the level of volatility is higher. likewise, if the ATR is lower, the level of volatility is lower. ATR is mostly used by traders in exits points
ATR gives an indication of only volatility but not direction.
5. Use the signals of the random index to buy and sell any two cryptocurrencies. (Screenshot required)
Using KDJ (Random Index) to Buy
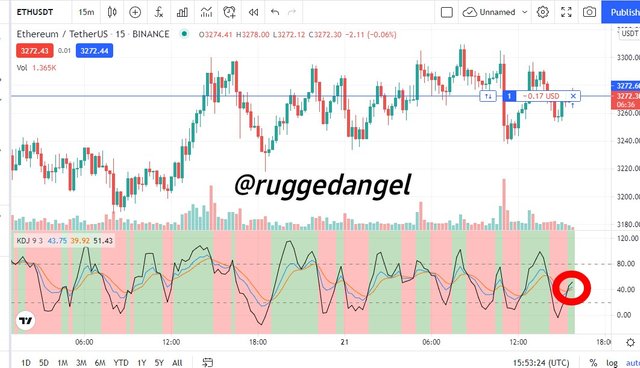
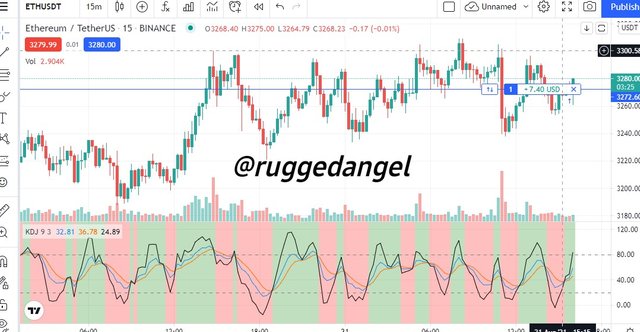
This is a candlestick chart of ETHUSDT and the timeframe is 15 minutes. The chart is from tradingview and the green candlestick represent up trending market price movements and the red candlestick represents down trending market price movements.
I opened a buy position at 3273.54. I took this decision because the KDJ indicator gave signals that i followed. The J line had gone beyond the 20 level mark then it went back up. As it went up, the J line converged and crossed over the cross over of the K and D lines. Also the background indicator showed green which furthers give more confidence on taking the buy position.
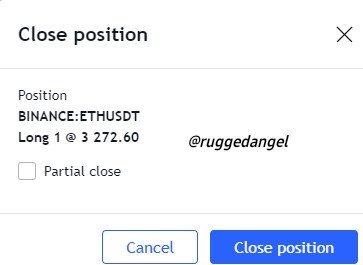
The open position became a successful one as the price gained $+7.4. So i decided to close the position after taking note that the J line has touched the 80 level mark. The position was closed at 3280.00.
Using KDJ (Random Index) to Sell
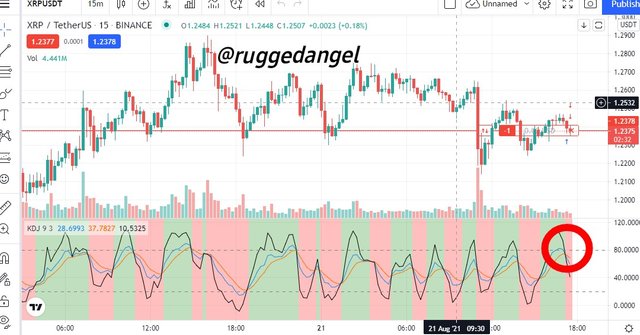
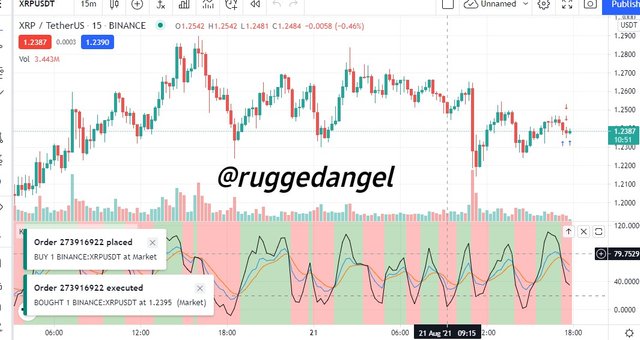
This is a candlestick chart of XRPUSDT with the timeframe being 15 minutes. The chart is from trading view.
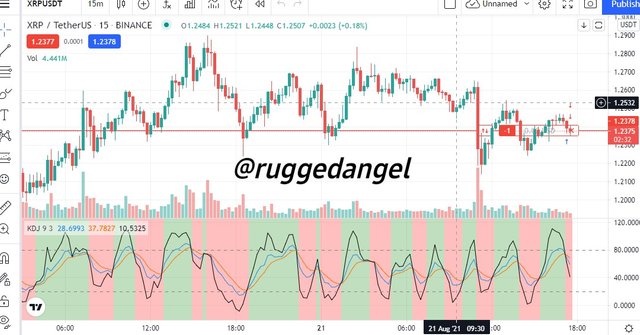
At the intersection between the J line and the K and D lines, i opened a 1.2378. The market moved to 1. 2375. I was convinced to open a sell market because the KDJ indicator gave a signal. The J line had gone above the 80 level mark then came down converged and crossed over the crosses of the K and D lines. Also the background of the indicator showed red color as the cross over took place.
The price was initial going down as the market moved to 1. 2375. Then the price started going back up so i had to close it.
IN CONCLUSION
The radom index (KDJ) is very important for all traders to know how to use For easy trading and making a wise decision during your trading. Special thanks to professor @asaj for this wonder lecture, i really learnt a lot.
Cc: professor @asaj

Superb performance @ruggedangel!
Thanks for performing the above task in the eighth week of Steemit Crypto Academy Season 3. The time and effort put into this work is appreciated. Hence, you have scored 8 out of 10. Here are the details:
Remarks
Overall, you have displayed a good understanding of the topic. You have performed the assigned task excellently. However, you did not provide screenshots of your demo account summary in task 5.
That said, this is good work. Thanks again for your contributing your time and effort to the academy.
Thanks professor @asaj for the review