Crypto Academy Season 2 Week 4 Homework Post for @kouba01
Greetings fellow steemians,
P

Introduction
Professor @kouba01 has delivered his lecture on how best to use the RSI indicator.
After going through his lecture and doing my own research I will now try to complete his homework task.
What is the Relative Strength Index - RSI and How is it Calculated?
This is a short term for Relative strength index.
In simple terms the Indicator RSI helps traders in bull cycle to determine the right moment to profit from their assets.
This means that because of the volatility in the cryptocurrency market, cryptocurrency asset sometimes goes on a bull cycle and this tool can help a trader know the best time to sell to maximize his profit before the market goes into correction.
We mostly fund that market goes on a bull cycle and traders are left wondering if they should sell their assets to make profit or they should hold on to them for a little longer.
With tools such as the Relative Strength index(RSI), traders can make their analysis before making a decision to know telegram best time possible to maximize their profits.
This tool was developed by Willis Wilder about 40 years ago.
It is used to determine the increasing and decreasing strength of prices.
The tool has a value between 0 and 100.
The tool has two limits set to determine if an asset is overbought or oversold.
When the tool shows a between 0 and 30 value it shows that an asset is oversold and when it show a value between 70 and 100 it shows that an asset is overbought.
how the RSI is calculated.
The formula is
RSI = 100- 100/(1+RS)
where the RS is calculated by dividing the Average earnings / a high period /a given period by the average loss over a high period during this period.
Can we trust the RSI on cryptocurrency trading and why?
The RSI indicator can be trusted in cryptocurrency trading but not always.
The RSI is a tool which is popular and is used by several traders.
When a tool is popular among traders or is widely used it means that it is a useful tool which mostly gives correct signals.
But as we know a tool cannot always be correct otherwise all traders would have tend to use this tooll for signal.
The RSI indicator sometimes do send false signals to traders.
I will advice that a trader should not only use the RSI indicator but should should other indicators in addition to the tool.
How do you configure the RSI indicator on the chart and what does the length parameter mean? Why is it equal to 14 by default? Can we change it? (Screen capture required)
In configuring the RSI indicator I will be using the trading view site.
Below are the steps;
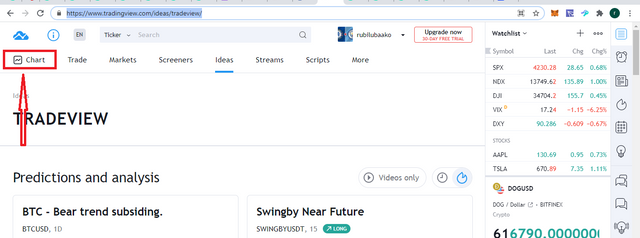
a) I will open the trading view site here
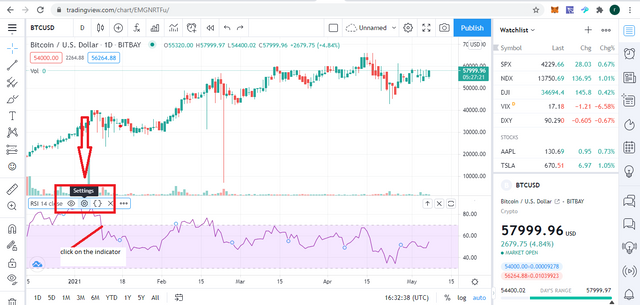
b)When it opens, click on the chart as indicated by the red shape.
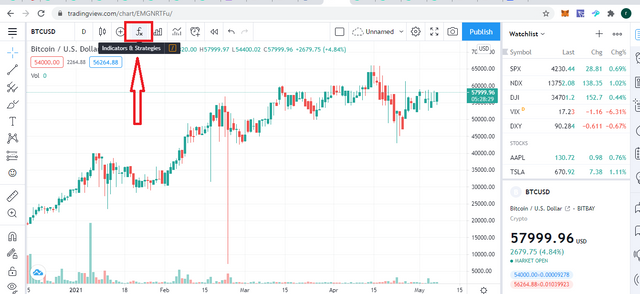
c)click on fx to show the indicators and strategies as shown by the red shape.
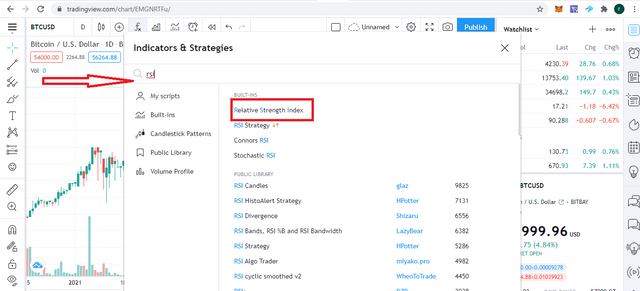
d) open the search box and type RSI and click on Relative strength index.
e) when the chart opens, click on the RSI indicator; this shows a pop up menu with more options.
Then click on settings.
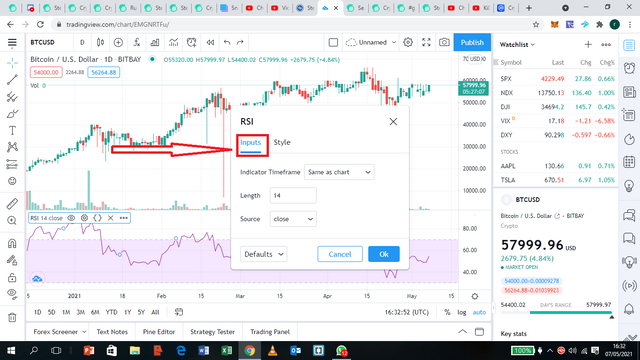
f) then click on inputs.
g) then click on style
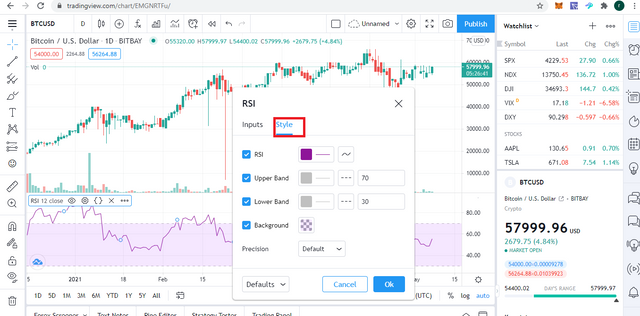
The length can be changed in the inputs section and the colors too, this can be done in the style section.
The outcome is displayed below.
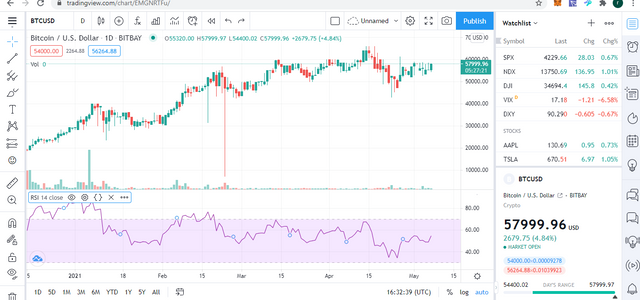
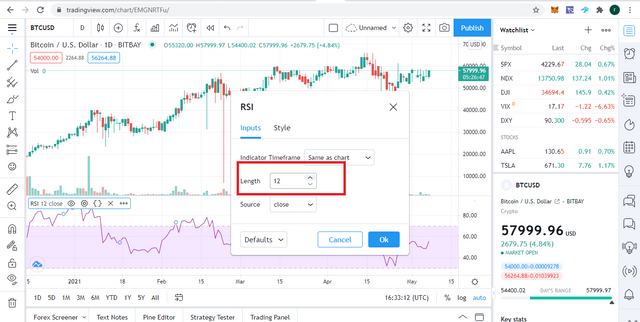
By default the period of the RSI indicator is set to 14, this can be changed as indicated below.
As I adjusted mine to 12
How do you interpret the overbought and oversold signals when trading cryptocurrencies? (Screen capture required)
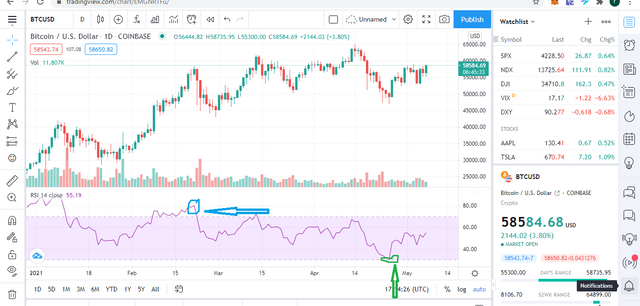
From the graph above I have marked the overbought signal with a blue arrow and the oversold signal with a green arrow.
When a cryptocurrency asset is overbought, it means that the demand for the asset has exceeded the supply in the way that the market price value increases.
Which means the RSI indicator level will go beyond the 70 value and be between the 70 and 100 value.
When a cryptocurrency asset too is oversold it means the supply is way beyond the demand of that asset.
This means that the price of the asset will fall.
Which means the RSI indicator level will fall below the 30 value and be in between the 30 and 0 value.
How do we filter RSI signals to distinguish and recognize true signals from false signals. (Screen capture required)
Sometimes real signals get caught up in the false signals
Sometimes it's the traders who read wrongly and sometimes it's the indicator that gives a wrong indication; this causes a deviation.
Now there are ways to get false signals on the indicator.
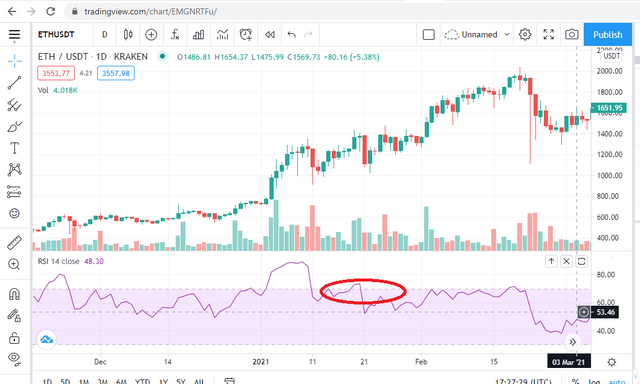
Bullish divergence.
This occurs when the price of the crypto asset falls lower than the limit but the RSI indicator shows a signal which is higher than the real signal
Bearish divergence.
This occurs when the price of the crypto asset goes beyond the limit but the RSI indicator show a lower signal which is not the real signal.
Review the chart of any pair (eg TRX / USD) and present the various signals from the RSI. (Screen capture required)
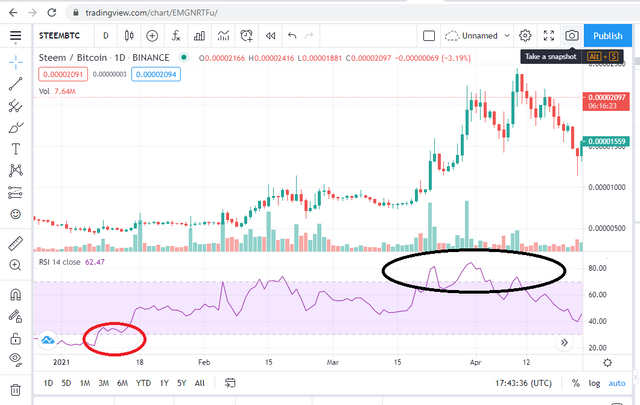
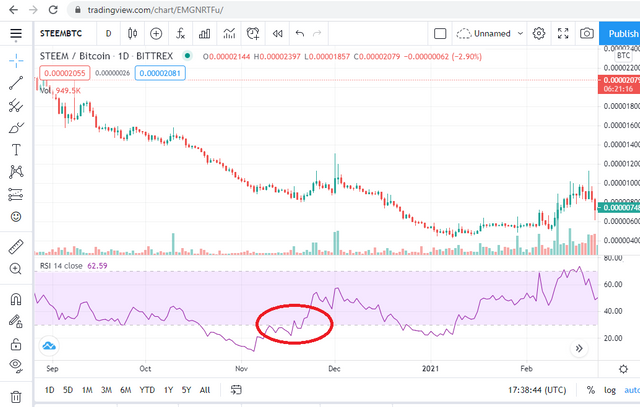
I will be using the STEEM/BTC in my analysis.
As shown by the red shape which indicates that steem was oversold as the indicator shows a value of below 30.
At this state it was not a good time to sell as the demand was higher and selling would not have made the trader enough profit.
As again shown by the black shape which indicates that steem was overbought as the indicator shows a value of above 70.
At this state a trader who sold his steem would have made good profits.
Conclusion
I find the RSI indicator to be a very useful tool even though it is not always truthful.
A tool that can really save a trader from a lot of stress and help him know the best time to take advantage of the volatility in the market to make maximum profits.
note- all screenshots are from trading view
Thank you.
Hello @rubilu123,
Thank you for participating in the 4th Week Crypto Course in its second season and for your efforts to complete the suggested tasks, you deserve a 7/10 rating, according to the following scale:
My review :
A good-content article that demonstrates your clear understanding of the questions. The question of signal filtering still lacks more depth in several points and for the last question, you had to analyze more the price change by adding other signals and not just oversold and bought signals.
Thanks again for your effort, and we look forward to reading your next work.
Sincerely,@kouba01
Thanks prof, I appreciate