[Alligator Indicator ]- Crypto Academy /S5W3-Homework Post for kouba01
Greetings guys,

Introduction
This week professor @kouba01 has delivered his lecture. A comprehensive lecture on the Alligator indicator. An indicator which is particularly interesting as it behaves like the animal it is named after. After going through his lecture I will now submit my assignment.
1. Discuss your understanding of the use of the Alligator indicator and show how it is calculated?
The alligator indicator is a technical analysis tool which is used by traders(forex traders, cryptocurrency traders , etc.) to make analysis of the market before making entry or exiting the market. It was created by Bill William which is why it is sometimes called the William Alligator indicator. The indicator consists of 3 moving averages which generally have 3 different colors. The colors are red, green and blue. It moving averages are set to periods 5, 8 and 14 respectively.
One particularly important thing about the indicator is that it is able to predict trend reversal in the market as it is able to predict buy and sell signals in the market.
As in the professor's lecture, he likened the behavior of the indicator to that of an animal. This animal is actually a crocodile which belongs to the Alligator family. Crocodiles are animals who tend to sleep a lot and when they they wake up they are very hungry and can eat up a whole meal. well the indicator behaves in that manner; the indicator tends to rest for long time and when it wakes up it makes up for it by following a lot of trend movements.
I made mention of the 3 lines which are used by the indicator, unlike other indicators which appear at the bottom of the chart, the alligator indicator is actually placed on the chart before reading is made. The 3 lines which are known as the jaw, teeth and lips have their separate colors. The jaw is the line with the blue color, the teeth has the red color and the lips have the green color. They all have the periods they are set to which I will talk when I am talking of how to calculate the indicator. But first below is the graph of an asset with the addition of the indicator.
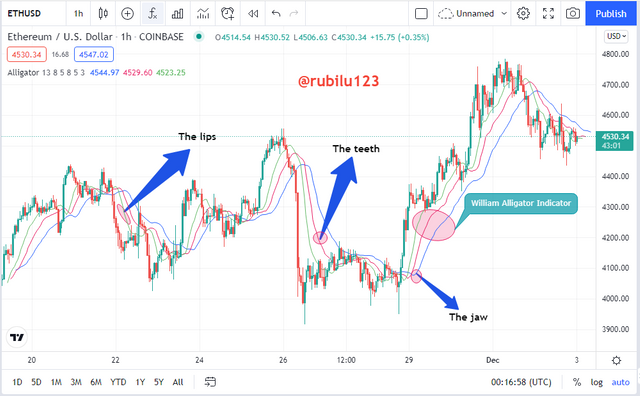
trading view
How it is calculated.
I have talked about the 3 lines which are very important above but I will through more light on them.
The three lines which are known as the teeth, jaw and lips all have separate colors as I said already.
The teeth - The teeth of the indicator has a red color. It has a period of 8 moving averages and can be adjusted to 5 periods.
The jaw- The jaw of the indicator has a blue color. It has a period of 13 moving averages and can be adjusted to 8 periods.
The lips- The lips of the indicator has a green color. It has a period of 5 moving averages and can be adjusted to 3 periods.
Now let us look at the formula;
Median price- (High +low)/2
Alligator teeth- MMA(Median price, 8,5)
Alligator jaw-MMA(Median price, 13,8)
Alligator lips-MMA(Median price,5,3)
Some of the abbreviations stand for:
High: This stands for the maximum High of the bar.
Low: This stands for the minimum low of the bar.
MMA: Moving Average.
The formula above is a mathematical formula which a trader uses to make a confirmation of his indicator by calculating his numbers. After calculations the trader can then know the decision to take whether its a buy or sell signal or the marker is on reversal phase. But as all other indicators, the indicator cannot he trusted 100% so the indicator can actually be placed with other indicators so that a user can get extra confirmation before taking any decisions in the market. The late signals that the indicator give is as a result that the indicator uses moving averages to make its reading or to give his signals.
2. Show how to add the indicator to the chart, How to configure the Alligator indicator and is it advisable to change its default settings ?. (Screenshot required)
Now I will show how the indicator is added to a chart on trading view platform.
First of all visit the (https://www.tradingview.com/) platform
and after opening it open a chart of your choice(ETH/USD)
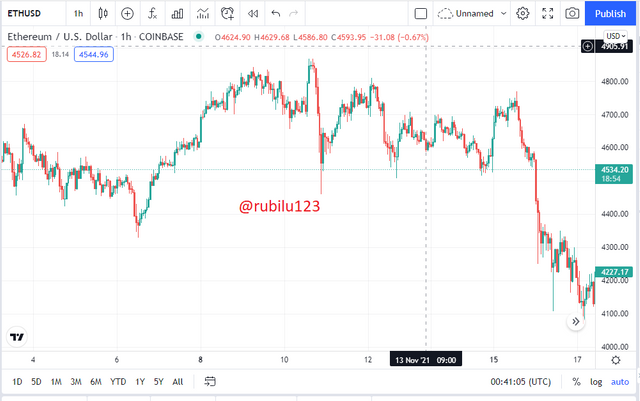
trading view
at the top of the homepage locate click on fx, which will be labelled as indicators strategies. A small menu pops up, search for alligator indicator and click on it.
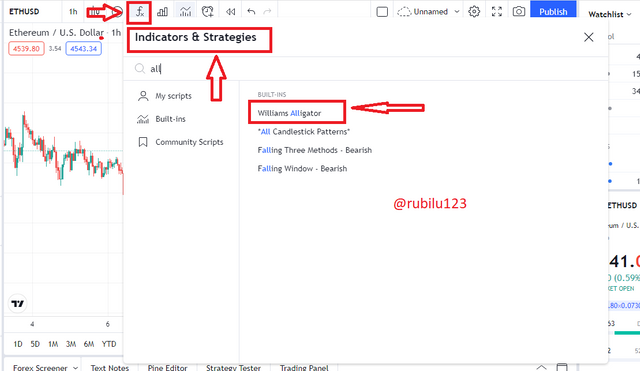
trading view
After clicking on it, it will be added to the chart as shown in the screenshot below.
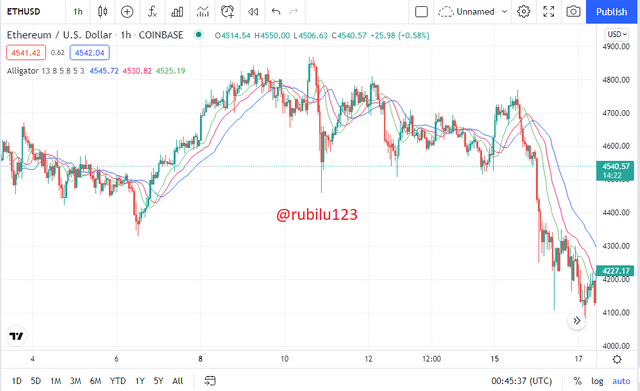
trading view
We have added the indicator to the chart and now let's look at how we can configure it. To configure the alligator left click on one of its line, you will see a menu open at the top left on the chart. Locate and click on the symbol shaped like settings which is known as the settings.
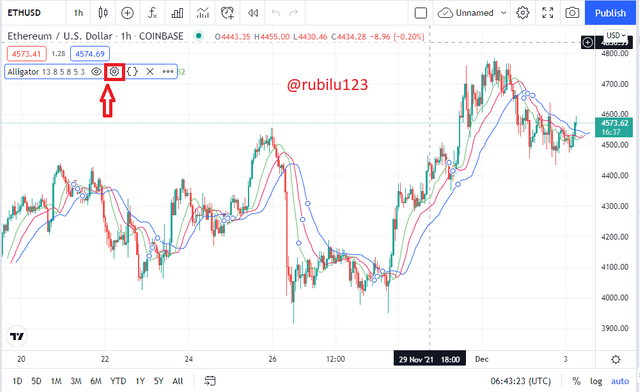
trading view
When we click on the button, a menu opens which contains the default or original configuration of the indicator. we see configuration such as inputs, style and visibility. Under each of these we have other options were we can further configure the chart. We have the option of adjusting the periods of the Moving averages under inputs. We also have the options of changing the color of the lines under style. We can also adjust a few things like the seconds minutes range and amongst others under the visibility.
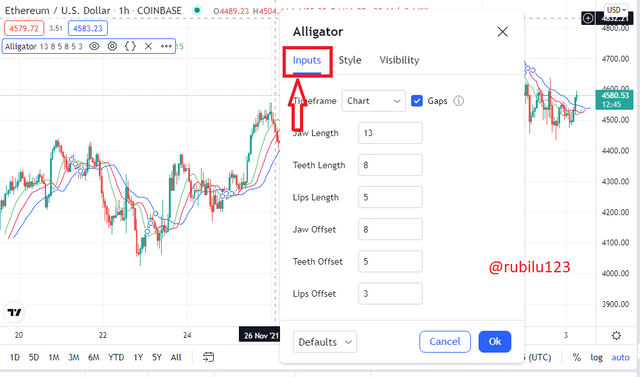
trading view
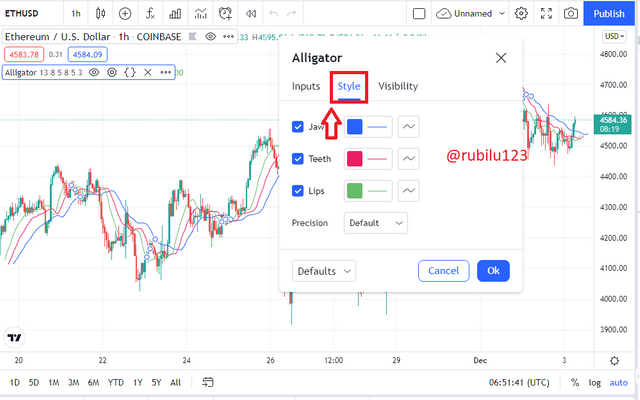
trading view
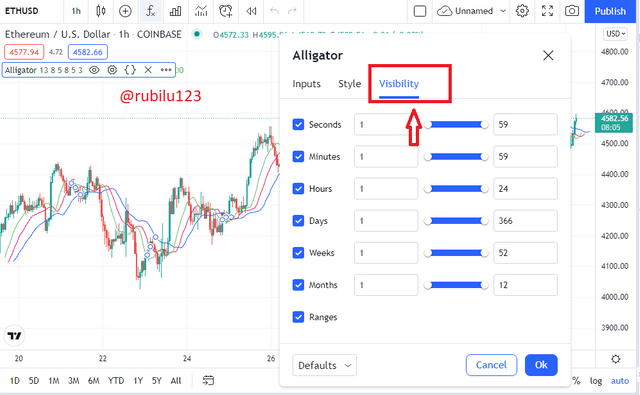
trading view
It is not advisable to change the configuration of the indicator as it is suggested by the creator. The reason being that the periods were developed on the basis of the fibonacci. The fibonacci is very important to these levels which from the support and resistance of the indicator. So changing the configuration might decrease the sensitivity of the indicator thus causing the trader to make silly mistakes. In the lecture, the professor made mention of the fact that a trader can actually play with the settings of the indicator in the demo account trading view just to get used to it but when he is using the premium account it is meant for serious business thus changing its configuration is not advisable.
3. How do we interpret this indicator from its 3 phases: the period of rest(or sleep), awakening, and the meal phase?(Screenshot required)
In a market we have different phases and they are all characterized by how the market is trending. We can have the period of rest phase which can also be known as the ranging phase. We also have the awakening phase and the meal phase, which will all be explained below.
Rest or sleep phase.
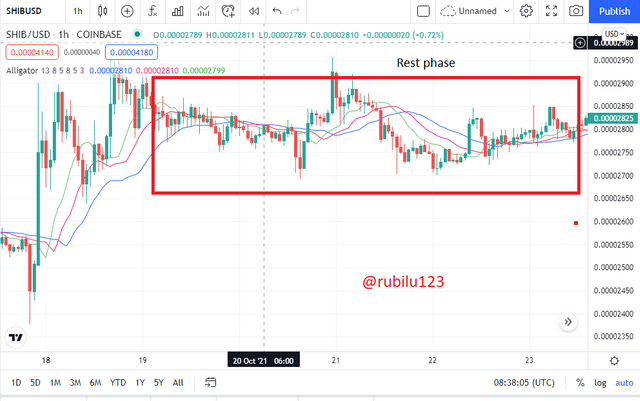
When we say someone is resting or sleeping it means the person has seized all his activities and is dormant at that particular time. As it is with humans it is the same with the alligator indicator. In the rest period of the indicator we see no movement from the indicator. The indicator shows this phase by putting together all its 3 lines. This means that when the indicator is in its rest phase the teeth, jaw and lips of the indicator are all dormant and see them mostly being close together. During this phase of the market I is not advisable to make an entry or exit from the market as the trend of the market is very difficult to predict when the indicator is at sleep. This can be likened to the ranging phase where we can say that all movements in the marker has potentially stopped.
trading view
In the chart above we can identify that the market is in the rest phase with the help of the indicator. We can also say that the market has gone into consolidation and from there onwards it is either bullish or bearish which is why it will be a wrong step for a trader to make a decision as a trader might make the wrong decision before entering or leaving the market. In this phase, the three lines of the indicator are constantly crossing each other so we don't know which decision to take.
Awakening or Meal phase.
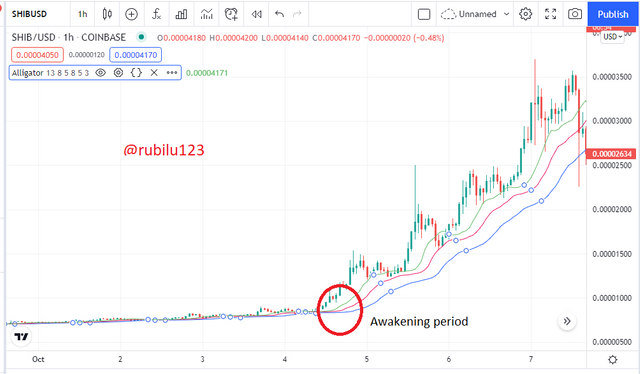
As the name suggests this is the time the indicator is waking up from sleep. When the alligator wakes up from sleep to our best of knowledge it has to quench its thirst cause after sleeping for a long time it will be hungry upon waking up. In this phase we will see the 3 lines of the indicator opening wider and diverging away from each other gradually. In this phase the 3 lines which are the lips, teeth and jaw will be crossing to indicate an entry or leaving.
trading view
From the chart above we can identify that the market is in the awakening phase with the help of the indicator. As I said already it is predicted that after the market has gone to sleep the market is dormant but when the moving averages of the indicators are crossing we can predict the market. When the lines are crossing and after that making gradual divergence from each other we will know if we are to leave the market or enter the market.
Meal phase.
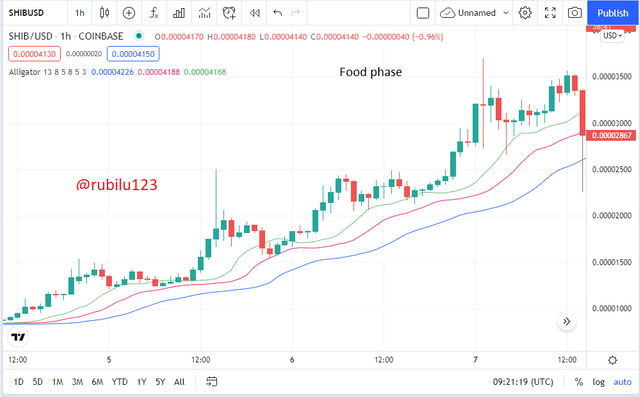
The meal phase as the name implies is the time the indicator makes prominent movements in the market. As we said when the alligator sleeps and wakes up it is very hungry so the meal phase is when it looks for food with it mouth opened as wide as possible hunting for food. In the meal phase we notice that the lips of the indicator which is the green color stays above the other 2 lines. But when the blue line overtakes the other 2 lines it might indicate that the alligator has finished eating thus a reversal might be expected. It is important to note that as the alligator is waking and preparing to eat up the marker, if the trend is going to be uptrend the green color known as the lips will be moving further apart and will be on top. This will indicate a strong bullish trend. If it happens that the blue line comes on top it the best time to leave as the market is preparing for a downtrend.
trading view
From the screenshot above we can see that the market is in the meal phase as the trend started nicely and we can see it picking up and continuing the bullish run as we can see the green line known as the lips is well apart and above the other 2 lines.
4. Based on the layout of its three moving averages that make up the Alligator indicator, how can one predict whether the trend will be bullish or bearish (Screenshot required)
The study of the 3 lines of the indicator is very important to the use of the indicator. The moving averages as they are called all how they behave depending on what ever phase the market is in. We have explained a bit about the sleeping phase, the awakening phase and the meal phase. Well the 3 phase are very important to the movement of the indicator and how is it used. We said above that when the lines are crossing each other and are very close or together we say that the alligator is sleeping. But when the lines are beginning or separate and move away from each other we can say that it is in the awakening and meal phase respectively.
trading view
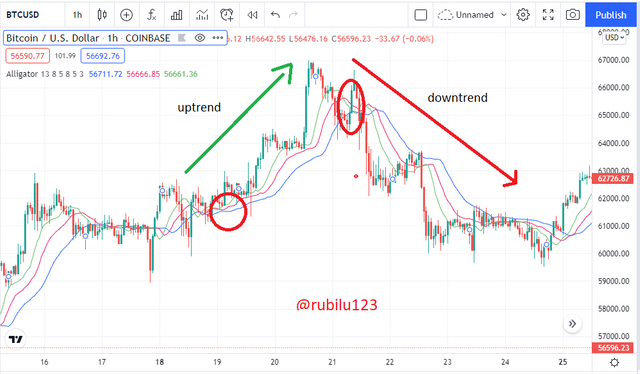
Looking at the chart above, on the part labelled uptrend with the arrow pointing upwards, we can see that the lips of the alligator which has the green color is on top of the other 2 lines. This depicts a bullish trend. And then the divergence of the 3 lines further apart from each other indicates that the market is preparing for a strong bullish run.
When we look at the right side of the graph where it is labelled as downtrend with the arrow pointing downwards. We can see that the jaw of the indicator which is known as the blue color is above the other 2 lines which indicates a downtrend. When this happens it shows that the market is going bearish and a further divergence of the blue line from the other 2 depicts a strong bearish cycle.
We notice that when the market was about to reverse from bullish to bearish the green line which is the lip of the indicator simultaneously blended in and went below the other 2 indicators allowing the blue line to come on top.
One important observation of the indicator is that when the market is in uptrend, the moving averages are placed nicely below the candle sticks, but when the market is in a downtrend the moving averages are placed nicely above the candle sticks. But in a ranging market or dormant market we can see that the indicator is nicely placed on the candle sticks to depict that there is no clear movement in the market.
5. Explain how the Alligator indicator is also used to understand sell / buy signals, by analyzing its different movements.(screenshot required)
The basic purpose of using an indicator is for technical analysis on assets. The technical analysis are done to know whether it is the best time to enter the market or leave the market. Mostly a technical analysis is needed after the trader has done his fundamental analysis and will need to confirm his judgement if he is right or wrong. The technical analysis tool all though is not 100% accurate but it is more accurate than a fundamental analysis. A basic understanding of bullish and bearish trends will help a trader better use and understand the alligator indicator.
We have explained above that when the green line moves above all the other lines and the indicator is well placed below the candle sticks, it indicates a bullish trend. To confirm a buy signal, the 3 lines will all come together and then we see the green line coming on top of all the lines. This indicates that the market is about going on uptrend and it is a good time to enter the market and take profit. When the 3 lines are diverging from each other and then we see the green line on top of the other 2 with the red in the middle and the blue beneath all the 3 lines we can say a syring bullish trend is building up.
Immediately the green line begins to cross the other lines and begins to trend downwards we can anticipate that the market is about to go on reversal. When a bearish trend is building we see that the green line gradually hides itself below the other 2 lines and then the blue line come up and it's on top the other 2 lines. Before the market goes on tr bearish run we will have a signal which will tell the trader when to leave the market and take profit. As soon as a trader sees that the green line is converging with the other 2 lines and then it begins to go under the lines, we will see the indicator adjusting itself and going above the candle stick. This is the the trader should leave the market as it is an exit signal.
You notice that when we are talking about the lines crossing, we tend to leave the red line out. This is because in all of the buy and sell signal phases the only work the red line does is to stay in between the green and red line. So whether It is a bearish or bullish trend you will always see the red line in the middle.
So from the explanation given we can take the following out to know how to use the buy and sell signal.
A buy signal can be seen as soon as we see the lines cross and the green line starts to deviate upwards above the other lines but a trader can wait for at least 3 periods to confirm the trend is valid.
A sell signal can be seen as soon as a bullish trend is ending or when the lines and the blue line starts moving upwards above the other lines.
A buy signal is valid by taking it when the market is about to trend upwards.
A sell signal is valid by taking it when the market is about to trend downwards.
The closing of a position can be done in two ways, however it depends on the trader. A trader can use the stop loss and take profit method.
The other method is waiting for confirmation from the signals before taking action. A trader can choose to wait till the line touches each other and the blue line over takes the rest or when the lines start to close together.
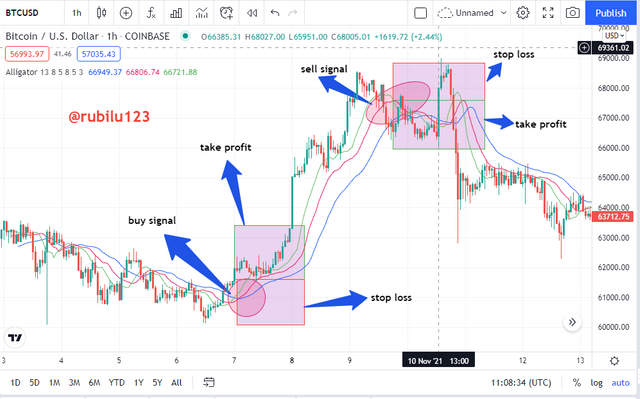
trading view
6. Do you see the effectiveness of using the Alligator indicator in scalping trading style? Explain this based on a clear example.(Screenshot required)
Scalping is a trading style which is mostly used by experienced traders in the market to gain profit off of small price changes and fluctuations due to the volatility in the market. What should be known is that a trader using the scalping method to take profits trades within a time frame of 1 minute to 5 minutes.
The alligator indicator is one of the indicators that can be used for the Scalping trade. Because the signals it give are mostly clear and a trader can use it to make profitable trades in the market. It should be noted that small profits are made off of the Scalping method.
We have spoken about how we can identify buy and sell signals using the alligator indicator, which will be very essential in our scalp trade. Let's look at an example in the chart below.
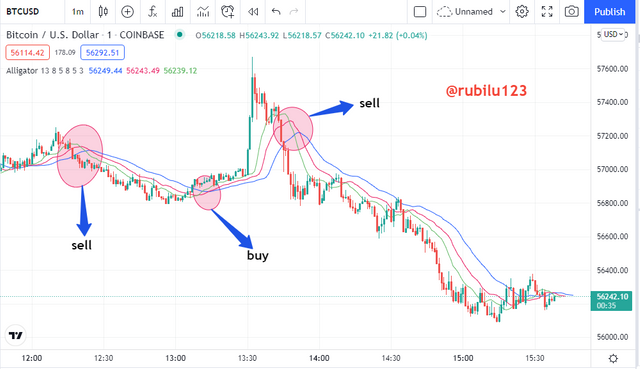
trading view
In the chart above, I have set my time frame of chart to 1min as we said that to take advantage of the market using the Scalping method the trader needs to use shorter time frames. In the BTC/USD chart you can see that the market is just coming from a downtrend phase so a trader cannot open a take profit trade there but a trader who opened a position can quickly take profit.
After a few seconds we are in the buy signal zone once more and the trader can buy the asset. This time round the bullish trend lasts for a few more seconds until the indicator begins to cross over to the bearish side so the trader exits and take profit cause a reversal is expected. In the next few seconds the market has reversed as expected so a scalper will wait till he sees another opening and then he can pounce and take profit.
The alligator indicator is actually a great tool for Scalping and talking profits off a smaller time frame.
7. Is it necessary to add another indicator in order for the indicator to work better as a filter and help get rid of unnecessary and false signals? Use a graph to support your answer.
A trader who uses a technical indicator to make his analysis knows that an indicator is not always perfect. The indicator sometimes generates false signals so it is sometimes essential to seek the opinion of a second indicator in addition the alligator indicator. The other indicator helps to filter out the false signals.
So in addition to the alligator indicator I will be using it in correspondence with the ADX indicator.
The ADX indicator(Average Directional Index) is an indicator tool that is used by traders to determine the trend of the market. This means that it helps a trader to know where the market is heading towards. Its use is slightly different from that of the alligator indicator. As the alligator us used to detect signals in the marker, it's use is to determine the strength in those signals. The alligator indicator shows the direction of the market but the ADX does not.
With the ADX indicator the values to take into consideration are 0 to 100. When the ADX line is above 25, it is said that it is a beginning of a trend and the moment the lie reaches the 50 mark it us said that the trend is getting strong. In this case the ADX indicator shows the same values for even it is a downtrend. This means that when the market is starting in a downtrend we can have the line being above 25 to indicate that the trend is true and then when the market is in a strong bearish trend the line will be above 50.
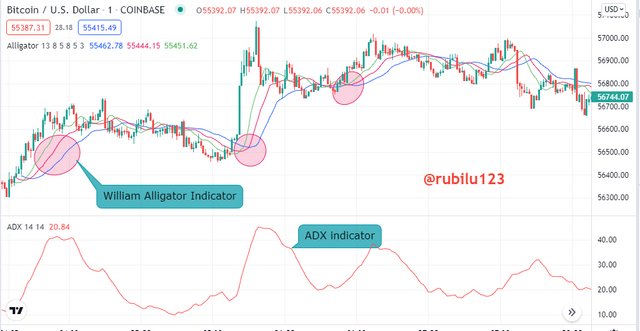
trading view
In the chart of BTC/USD above, you will notice that the I have added the ADX indicator and the alligator indicator. I have also marked two points which are buy signals. Upon adding locating the signals we want to confirm if our trend is really strong to make an entry into the market to take profit. For the first buy signal the ADX indicator is above the 50 mark which shows that our trend is really strong and it shows that the bullish cycle Is strong this a good time to enter the marker and take profit. The ADX has confirmed our buy signal for us and from there we can make an entry.
For the second by signal, the ADX is not backing it up to be strong but the line is above the 25 mark so it shows that a bullish trend is opening. The ADX has confirmed to the trader that the trend is not really strong thus a reversal could occur soon. Then the trader can make a decision.
But the best decision will be to wait until there is a clear buy signal from the ADX and the alligator indicator.
8. List the advantages and disadvantages of the Alligator indicator:
Advantages
The alligator indicator is an easy to use indicator particularly because it has been likened to a real life scenario thus very easy for a beginner to read and understand.
Buy and sell signals on the indicator are easy to predict.
With the 3 lines of the indicator, the phases of the market are easy to predict depending on who's on top of the rest.
it is good for taking profits in the short term and in the short term.
Generally it generates lesser false signals than the other MA.
Disadvantages
It sometimes gives false signals even though it really happens.
Signals are sometimes delayed if used on a shorter time frame.
Conclusion
The alligator indicator is a relatively trust worthy indicator when compared with other indicators that work with only 2 moving averages. I believe it is easier to use than most indicators as it has been likened to the cycle of the alligator thus if you even forget how to read it think of how am alligator feeds and goes back to sleep.
It has a lot of advantages but as we know an indicator can never be perfect considering that the cryptocurrency market is volatile. The indicator can predict that this will happen and it wouldn't happen. Even though it can be used in addition to other indicators such as the ADX indicator to fish out false signals, it can still be wrong.
With the alligator indicator, scalpers have am edge of making and taking profits earlier before the market goes against them. Finally it is always best to wait until the signals are clear from the indicator before taking a financial decision in the market, if incase you are not sure employ the use of a second indicator.
Thank you.
Wow you really did a good job, more post from you stay safe always rubilu123🙂
Thank you buddy ☺️