[Trading Using Wedge Pattern] - Crypto Academy / S5W5 - Homework Post for @sachin08
Hello everyone and welcome to my homework post. Today I will be talking about the wedge pattern which is also a trend strategy used for making trading decisions. Like the other patterns strategy we learned from professor @sachin08, this one also deals with both market structures (Bullish and Bearish) and Mark's support and resistance of minor highs and lows.


Explain Wedge Pattern in your own words.
This trading strategy called the wedge pattern is that which uses price movement convergence by making supports from minor lows and resistance from minor highs. This happens when volumes decrease together with the formation of price convergence.In order to make this description easier to understand, I would like to say that the wedge pattern is done in the following manner.
Simply wait until there’s convergence of prices, meaning the price makes lower highs and at the same time it makes higher lows. If this scenario is witnessed in the price chart then you draw a line joining the minor highs (this line will be called the resistance line) and another line joining the lows ( this is the support line). Normally both lines will converge to a certain angle. The trading volume at this point will be decreasing from the start of the convergence to the most converge sector of the chart.
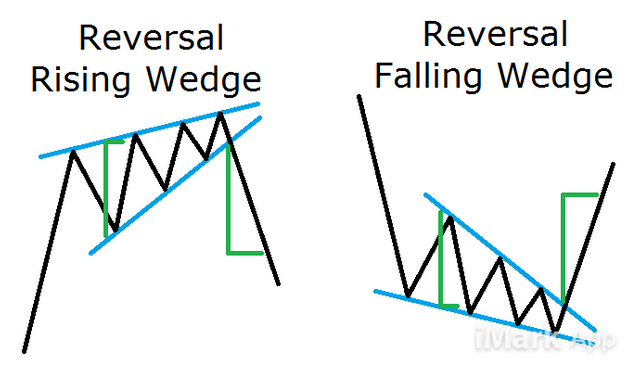
Different wedge patterns Source
The screenshot above shows what the wedge patterns look like. We can see both forms of wedge patterns. Therefore we can say that the wedge pattern represents a slow in an ongoing trend waiting for a reversal or a trend continuation.
From this, we can tell that the wedge pattern can only signify a trend reversal (at the top of a trend) or a trend continuation (at the middle of a trend). Trading is based on catching good entry points and therefore as soon as a reversal and trend continuation takes place, traders have good entry opportunities.
This pattern can be applicable in both bullish market structure (where the wedge will point downward) and the bearish market structure (where the wedge points upward). This already describes the two main types of wedge patterns. I will love to explain later. The bullish wedge like I said is that which is converging downward while the bearish is the opposite.
It’s normal to see pattern breakouts give false information and this has been the reason behind many trend pattern strategies. To make the wedge pattern a success, traders employ the use of filter indicators to best identify breakout that are false or true. In this case false breakouts will be limited.
Explain both types of Wedges and How to identify them in detail. (Screenshots required)
There exist basically two types of wedge pattern and using both will give high chances for bullish and bearish market entries. These two categories are the rising and falling wedge patterns. Below is a detailed explanation for both patterns.
This wedge pattern category forms when price trades with a convergence pointing downward. Like I said this convergence forms when the price trades making lower highs and higher lows at the same time.
In this case we draw a support and resistance lines which will intersect at a certain point. When the rising wedge pattern happens it’s either there’s a bullish trend continuation or a bearish reversal is about to take place. Below is a price chart showing a rising wedge pattern.
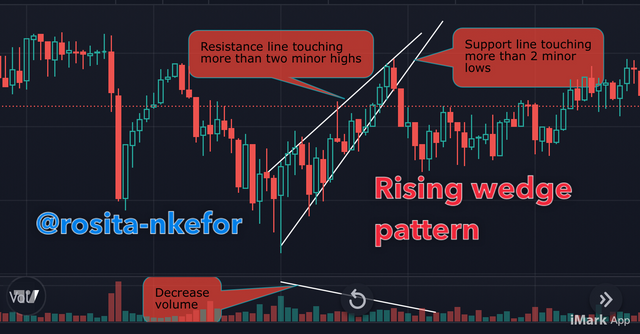
XRP/USD chart Source
From the screenshot above we can tell that the price trades into a slowdown in high formed a convergence making the resistance line and the support line to form an intersection. We can see how both trend lines (resistance and support) are touching at least two candlesticks of minor lows and highs. To identify a rising wedge pattern we have to follow the guidelines below.
Wedge direction: The first thing I always check is the direction to which the wedge is pointing. For a rising wedge it should be pointing downward.
Support and resistance: Draw the support and resistance lines joining minor lows and highs to form the wedge and conform the direction.
Trading volume: From the point of formation of the rising wedge the trading volume should decrease progressively until breakout.
Putting all these together will make a good trading plan for a rising wedge pattern. An additional instrument to add would be the filter indicator.
This is the other type of wedge pattern and is known to form converging support and resistance lines that may intersect. The significance of this pattern is that of a bearish trend continuation or a bullish trend reversal.
Therefore seeing a falling wedge on a bullish market we have to prepare for a trend reversal whereas seeing it on a bearish market, we prepare for trend continuation. The screenshot below shows more about the falling wedge pattern.
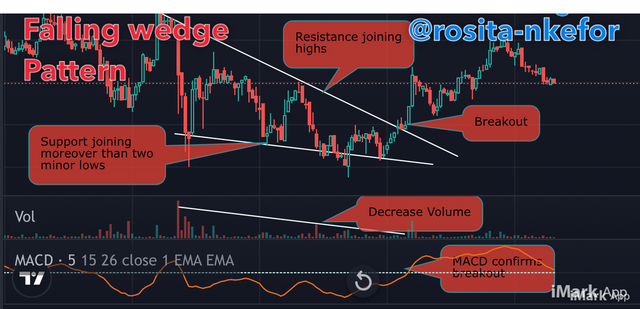
BTC/USD chart Source
The screenshot above vividly describes the price convergence as can be seen from the trend lines (support and resistance lines). These lines join points of lower highs and higher lows.
It should be noted that the formation of the falling wedge pattern is an indication of a bearish trend reversal or a bullish trend continuation. Below are guidelines on how to identify and analyse a falling wedge pattern.
Wedge direction: As seen on the rising wedge, the falling wedge is the complete opposite. Therefore the falling wedge will form a price convergence pointing downward.
Support and resistance: The lines (support and resistance lines) joining higher lows and lower highs will be placed pointing downward. These lines must be touching at least two candlesticks representing lower highs and higher lows.
Trading volume: The volume of the price will decrease from the beginning of the price convergence formation process.
Taking note of these guidelines one can set up and manage the falling wedge pattern very easily.
Do the breakout of these Wedge Patterns produce False Signals sometimes? If yes, then Explain how to filter out these False signals.
Normally, trend pattern strategies as a whole may easily produce fake breakout signals and making entry based on just a breakout without further confirmation might lead to loss of funds. To solve this problem on the wedge pattern strategy it is advisable to use a false breakout filter indicator which will be used to for confirmation after there has been a breakout from the trend strategy in place.
With the above statement we can say it’s possible for there to be a false breakout on the wedge strategy on any price chart. To treat or filter such breakouts I recommend that we employ the use of any indicator that has a zero level which will help us know when we are at a bullish market or bearish market provided price trades below or above the zero line of the indicator. Most at times the wedge pattern breakout will take place and in few moments the indicator will confirm the new move. In this case almost always a gab of about two candlesticks for confirmation.
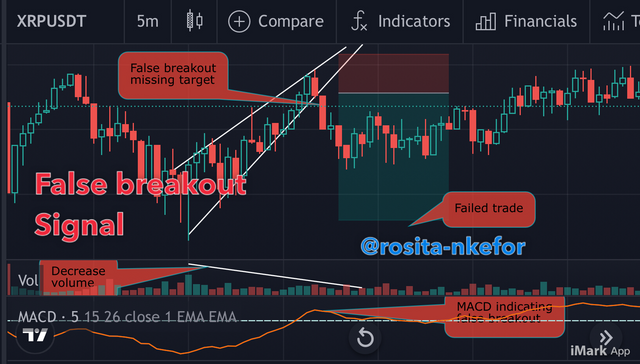
XRP/USDT chart Source
We can see a false wedge pattern breakout signal on the above screenshot which would’ve led to loss of funds had it been one made an entry at such a position while using the wedge pattern strategy.
For the effect of filtering out such false breakouts to minimise losses we’ll look into how we can use the Moving Average Convergence Divergence (MACD) indicator. I will not go deep into the indicator set up because I’m considering this already known. This indicator has an alternating line that moves up and down crossing the zero level at different times. When below the zero line we have a bearish market and when above we have a bullish market. Therefore at the point of crossing the zero level we can make good entry positions for either buy long or sell short.
The MACD indicator
Like I said, our focus will be on the zero line whenever our price breaks the zero line we look for an entry position depending on the strategy guidelines I gave above. As soon as the wedge experiences a breakout we move straight to the MACD indicator to check if it just crossed the zero line or not. In som special cases the MACD might touch the zero line for a pullback and continue the main trend again in which case we talk of trend continuation.
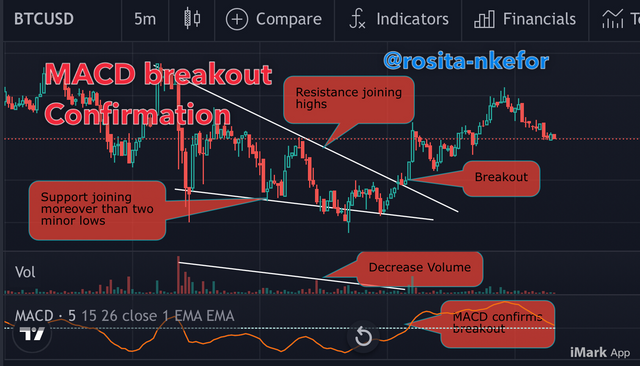
BTC/USD chart Source
The above screenshot shows the confirmation of a trend breakout by the MACD indicator after the wedge pattern breakout took place. We can see that the MACD oscillator just crossed the zero line after the breakout. This confirms our entry for good profits with some level of confidence since we know we have escaped false breakout by filtering the signal.
Show full trade setup using this pattern for both types of Wedges.( Entry Point, Take Profit, Stop Loss, Breakout)
With the additional filter for false breakout signals, the entry and exit strategy for the wedge pattern becomes easy to maximise profit. Below I have described these trade set ups using screenshots of both types of wedge patterns.
- Rising wedge pattern trade set up
ETH/USD chart Source
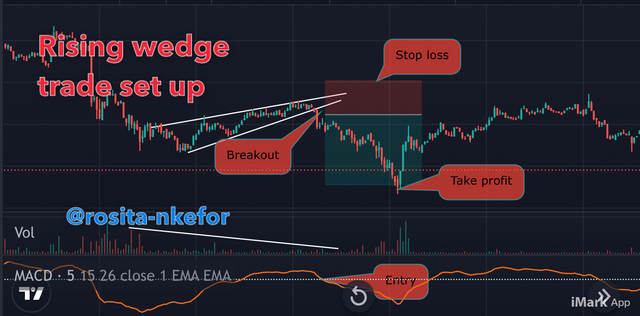
The above screenshot shows a complete set up of the rising wedge pattern. We can see the MACD indicator confirming entry points. After following the guidelines by checking the convergence direction of price movement; drawing the resistance and support; checking the progressive decreasing volume; entry confirmation from the MACD, I made my entry and set take profit and stop loss with a ratio of 1:1.5 to 1:2.
The stop loss is just slightly above the trend line on the other side just beneath or above the breakout position. The take profit considers the last impulsive move and may be 1.5 to 2 times the Stop Loss.
- Falling wedge pattern trade set up
BTC/USD chart Source
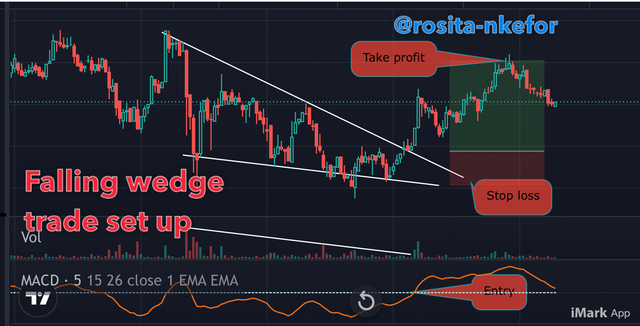
The above screenshot completely shows the falling wedge pattern and how together with the MACD filter makes good entry points.
By taking note of the above guidelines for a falling wedge pattern I managed to come out with an entry and exit plan as seen on the screenshot. Like the rising wedge, my risk reward ratio is 1:1.5 or 1:2. Take profit and stop loss are in the same manner. The entry is only made when the price meets the zero line of the MACD indicator.
Conclusion
The wedge pattern like other trend trading patterns are diverse in nature and can be used on different timeframes and different market structures. Adding a filter indicator to this strategy will help filter noise in the form of false breakout signals and therefore enhance the ability to define good entry points that will yield good profits.
A big thank you to professor @sachin08 for taking me through different trend pattern strategies in other To have many options on the market table. Between these pattern strategies you will always find one on every trading pair. We have come to the end of my task for the week.
Thanks for reading.