[REPOST] [Psychology of Trends Cycle] - Crypto Academy S6W4 - Homework Post for @reminiscence01

Hello my dear friends and welcome to my homework post for professor @reminiscence01.
Psychology of Trends Cycle

The Dow Jones theory is a theory in finance that let's us know that the market conditions. It is a useful form of technical analysis in the market.
In order to fully understand this theory, we must know what it considers. Firstly, the theory considers that all information about how that asset is doing is found in the price i.e it discounts everything assuming that price has all the information that is needed.
He also believed that the market had primary trends which are the trends of the market in a year, secondary trends which are periods in the market trying to go against the primary trend and occur for about 3 weeks to 3 months and
tertiary trends which on the grand scale of things are not that important and occur in less than 3 weeks
He also considers that the primary trend of an asset has two phases known as the accumulation phase and the distribution phase. Furthermore, the volume of the asset has to confirm the trend at any given time as volume gives an idea of the number of people who want the trend to go up or go down.
So if the trend is reversing, it will accompanied by a large bearish volume. But if the pullback is just a secondary thing, the volume will be low.
Now how do we explain the psychology behind the accumulation and distribution phases of a trend?
Accumulation Phase
As we are aware, the actual people who move the market and are responsible for the trend going on in the market are the big investors or whales. With their huge amounts of money, they can join and decide how the market should go.
When the market has completely bottomed, i.e most investors have sold their assets, whales and other early investors see this as the perfect time to buy the asset because the price is low.
As they are buying, some retailers who cannot see the work of the big investors behind tend to sell their assets and make small profits. Thus, the market will be ranging at this point.
So just like the name suggests, the accumulation phase is the period when majority of the investors are amassing that asset in it's numbers.
After this period, the momentum gathered sends the market into a bullish run. But along the way, some investors take out their profit. This brings us to a reaccumulation phase where more investors find that as a good entry point to amass the asset. The momentum causes the asset's price to keep rising.
Below is an illustration of the accumulation phase on a BTC /USDT crypto pair.
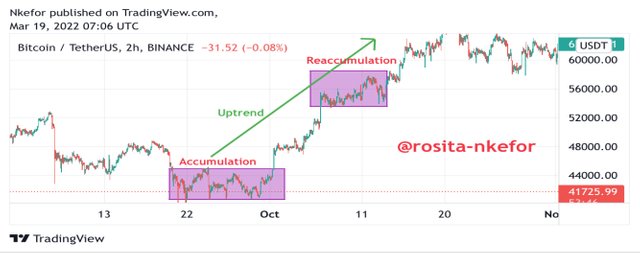
As you can see in the illustration, when the market has gone right to the bottom, accumulation starts. Then the market goes bullish for a while before taking a break to gather more momentum.
Distribution Phase
The distribution phase can be seen as the opposite or reverse of the accumulation phase. After the price has gone bullish for a long time and the market has topped that is reached it's highest point possible at that time, the investors have made enough profit as they want so they then start taking their profits by selling the assets in their hold.
The release of large amounts of the asset into the market causes the prices to plummet as supply becomes way more than demand. So distribution as the name suggests can be seen as giving out the massive proposition of assets you have to the world.
This massive distribution causes the sellers to gain dominance which send the price is a bearish run. But after they price has gone bearish for some time, some retailers try to renter the market and buy. Also, not all the big investors had decided to sell.
This causes the market to consolidate for a while. Then the others release their hold on their assets causing a redistribution phase and the market goes right down in a very strong downtrend.
Below is an example of the distribution phase on a BTC/USDT crypto pair.
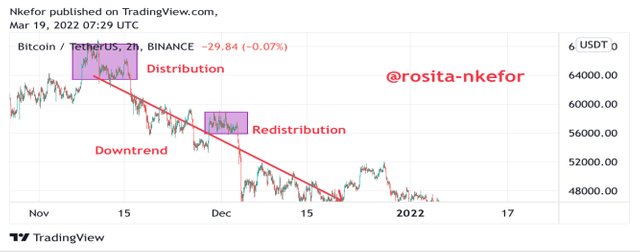
Let us take note of something. The accumulation phase and the redistribution phase comes as a result of the retailers thinking that the trend is about to end and closing their positions. So they are being manipulated and can sometimes it and up in losses.
And this happens because most of them follow secondary trends instead of primary trends. Whereas it is primary trends that show the true trend of the market.
So in order to avoid being manipulated by the big investors, the knowledge of the trend cycle is very very important.
As we know, price does not just move in a straight line. Rather, it oscillates forming peaks and troughs. Now, we can determine the phase of the market based on the position of the different highs and different lows.
There are three types or phases of the market namely the bullish market, the bearish market and the sideways market.
Bullish Market
A bullish market is one where each new peak is higher than the previous peak and each new low is higher that the previous low. So it consists of higher highs and higher lows.
If resistance and support lines are drawn in such a market, the end result will be rising resistances and supports marked along the higher highs and higher lows.
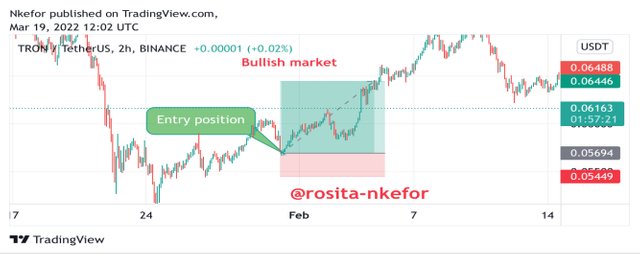
A good example of a bullish market is found below on the TRX/USDT crypto pair in the 2 hour timeframe.
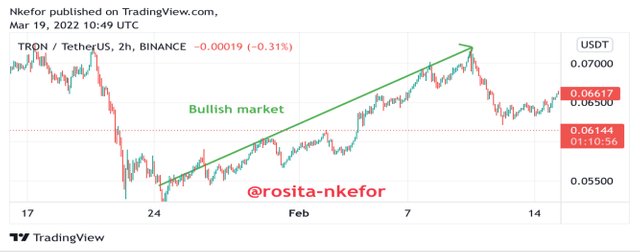
When the buyers gain more power and dominance in the market, they force the price to move up causing a bullish market. This phase of the market is usually observed after the accumulation and reaccumulation phase.
Bearish Market
A bearish market is simply one in which each new high is lower than the previous high and each new low is lower than the previous low. So it consists of lower highs and lower lows.
If you identify your resistance and support in such a market, they will be drawn across the lower highs and lower lows, forming sloping trendlines.
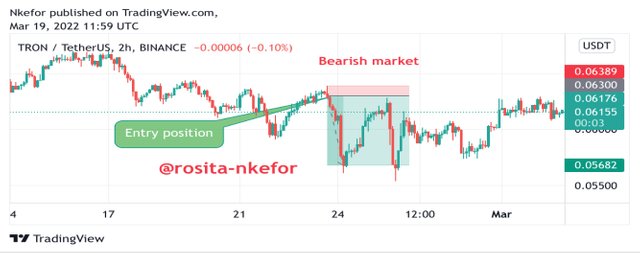
An example of a bearish market can be seen below on the TRX/USDT crypto pair in the 2h timeframe.
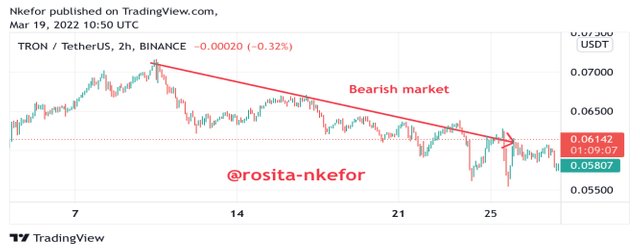
The bearish market comes to be because the sellers have more dominance and have taken over the market for that period. This type is usually observed after the distribution and redistribution phase in the market.
Sideways Market
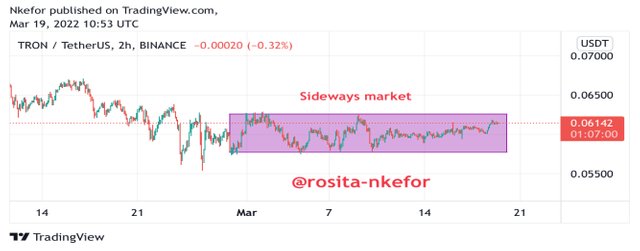
As the name suggests, this type of market is one which is neither moving up nor moving down. Each new high is found almost at the same position of the previous high and each new low is found almost at the same position of the previous low.
If you draw your resistance and support lines, they'll be horizontal and you will clearly see that the price is bouncing between both lines.
The sideways market is a phase where the market is in equilibrium. Buyers and Sellers are fighting for power with each of them at almost the same level. We say that market is consolidation.
If the buyers gain control, the market become bullish. But if the sellers gain control, the market becomes bearish.
The sideways market is clearly seen in the accumulation phase where the buyers finally gain control and in the distribution phase where the sellers gain control there.
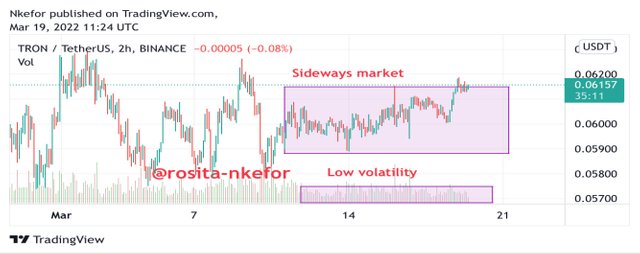
Below is an example of a sideways market on a TRX/USDT crypto pair in the 2h timeframe.
In understanding trends, the volume indicator plays a very important part in ensuring that we don't become a victim of price manipulation.
No how does volume does this? Volume helps us to understatnd the volatility in the market which depends on the length of the bars and also who is in control which is shown by the colours of the bars. So how does volume confirm our markets?
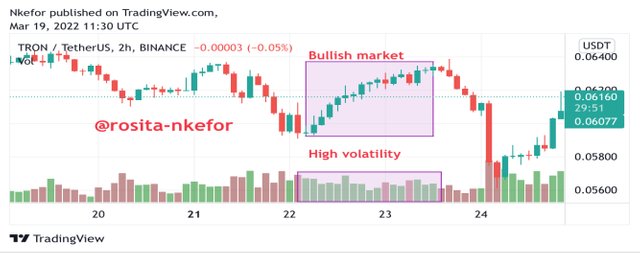
Volume and the Bullish Market
When the market is bullish, it means that the buyers have dominance over the market.
The volume indicator confirms this by having long mostly green bars. The long length signifies that there is high volatility in the market at that time. While the mostly green colour shows that the buyers are in control.
Below is an example on a TRX/USDT crypto pair in a 2h timeframe.
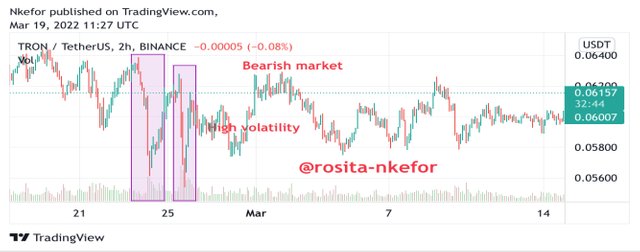
Volume and the Bearish Market
When the market is bearish, it means that the sellers have gained control over the market. The volume indicator confirms this by producing long red bars at that period. The length shoes that there is high volatility in the market while the red colour shows that the sellers are in charge.
Below is an example on a TRX/USDT crypto pair in a 2h timeframe.
Volume and the Sideways Market
When the market is sideways, it indicates consolidation of price. That is the sellers and buyers are trying to gain control of the market.
The volume indicator confirms this by having short bars of bothered and green. The short bars show that the volatility at that time is quite low. While the different colours show that both the buyers and sellers are fighting for control.
Below is an example on a TRX/USDT crypto pair in a 2h timeframe.
Trade criteria for a bullish market
When you want to trade in a bullish market, certain things must be considered. Firstly, make sure that each new high or low is higher than the previous high or low.
When you are certain that the market is bullish you can go ahead now to look for a good entry position to place a long trade.
Now to find that entry point, allow the price to form a new higher low. When that low is formed, as soon as a two bullish candles form, go ahead and place your long trade. Your stop loss should not be lower than your most recent higher low.
This is illustrated below in a TRX/USDT trading pair in a 2h timeframe.
Trade criteria for a bearish market
To trade in bearish market, you have to ensure that the market is indeed bearish first. This is bdone y checking that each new high or low is lower than the previous high or low.
Now we have to look a good entry position to make a short trade. In order to do this, wait for a lower high to be formed first. After it's formation, wait for at least one bearish candle pattern to appear and then you place your trade.
This is illustrated in the TRX/USDT crypto market in a 2h timeframe below.
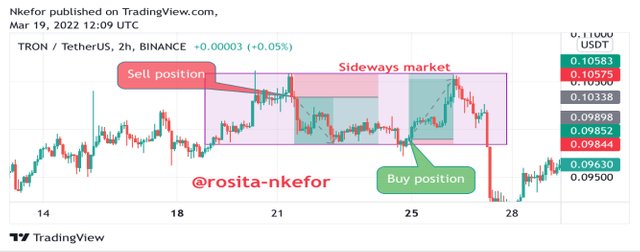
Trade criteria for a sideways market
To trade in a sideways market, first of all ensure that the highs formed are almost at the same place and that the lows formed are almost at the same place.
Once this is confirmed, draw resistance and support lines across the highs and the lows respectively. Now here is how you'll be trading.
When the price hits the support line and bullish candles start forming, place your buy trade. When the the price hits the resistance line and bearish candles form, place a short entry rather. For this of types trade, your stop loss should not go past the resistance or the support level.
But also keep in mind for breakouts. If there is a successful breakout from the resistance line, place a long trade. And if there is a successful breakout from the support level, place a sell entry.
This is illustrated on the TRX/USDT crypto pair in the 2h timeframe below.
Buy position
For this trade, I used the GRT/USDT crypto pair in the 5 minute timeframe. I observed that the market was bullish as each new high was higher than the previous high and each new low was higher than the previous low.
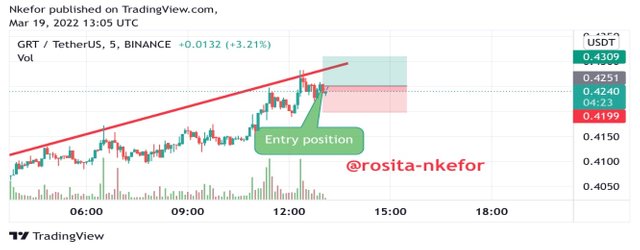
I waited for the price to retrace itself to a low higher than the previous one. Then, I placed buy trade at that point. I made sure my stop loss was at the previous previous low and then set my tale profit higher than my previous high.
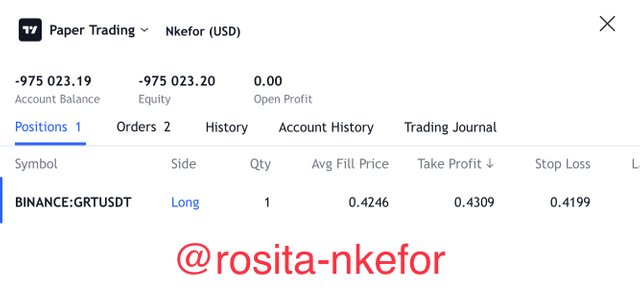
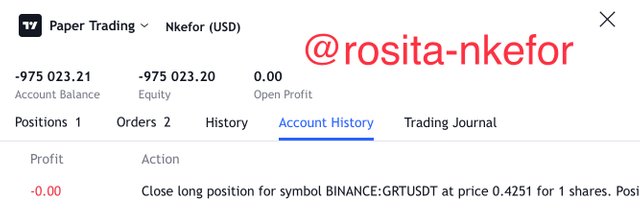
But as you can see, I didn't calculate well and my stop loss was not large enough to contain the rebound.
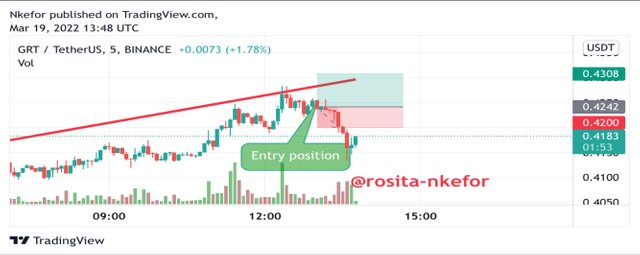
So I made losses of 0.00 USDT.
Sell position
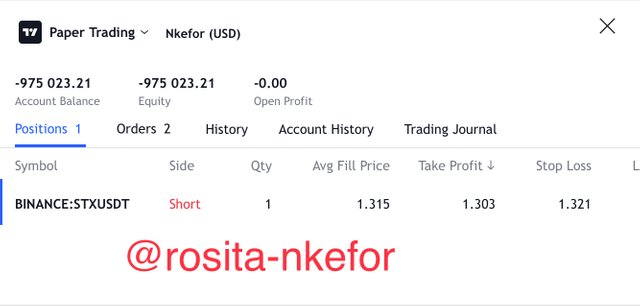
I performed this trade on an STX/USDT crypto pair in a 3 minute timeframe.
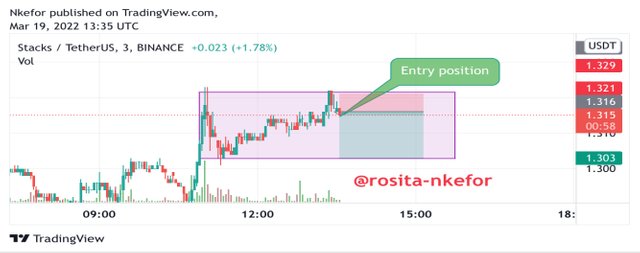
I noticed that the market though in an uptrend, it's new high was at around the old high. So I anticipated the low will follow the same way forming a ranging market.
So after drawing my horizontal resistance and support, I placed my sell trade when the price rebounded from the resistance. My stop loss was at the resistance line and my take profit was at the support line.
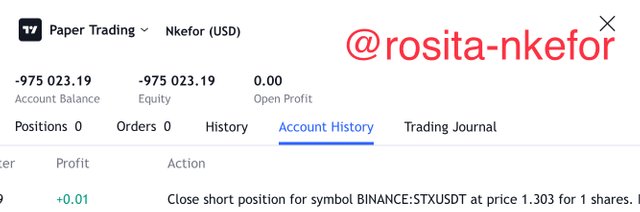
Just as I expected, the price hit my take profit and had a false breakout at the support level before moving upwards back.
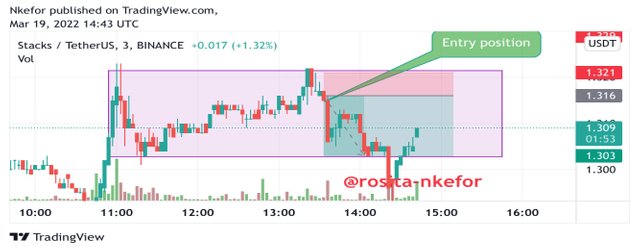
I had made a profit of 0.01 USDT.
We need to understand the phases in the market which are the accumulation and distribution phases. We also need to understand and know how to use the different markets which are the bullish, bearish and sideways markets.
Knowing all these will help us understand how the market is behaving. It will also help traders know when best to place their trades in order to make profits.
Thanks for reading.