[Candlestick Patterns] - Steemit Crypto Academy Season 4 - Homework Post for Task 10
Hello, dear friends of the Crypto Academy. I am pleased to present my homework on task 10, lectured by professor @reminiscence01.


Candlestick Patterns by @rosita-nkefor
2 a) In your own words, explain the candlestick patterns and their importance in carrying out effective technical analysis.
b) In your own words, explain the psychology behind the formation of the following candlestick patterns.
- Bullish engulfing Candlestick pattern
- Doji Candlestick pattern
- The Hammer candlestick pattern
- The morning and evening star candlestick pattern.
- The Harami Candlestick pattern.
a) In your own words, explain the candlestick patterns and their importance in carrying out effective technical analysis
Before we go any further, I will like to make a few relevant definitions that will offer more comprehension. These will include candlesticks, candlestick charts, and then candlestick patterns.
If you have ever looked at the price chart of any cryptocurrency pair, you must have seen green and red thick lines, often with wicks. Those are referred to as candlesticks due to their similar appearances to real-life candlesticks. In technical terms, candlesticks are single bars that show information about the movement of the price of a good or asset.
They are made up of an upper shadow, a real body, and a lower shadow. There are two types of candlesticks; a bullish and a bearish candlestick. A bullish candle is generally green with the price closing in the upper shadow and opening in the lower shadow. While a bearish candle is generally red with the price opening at the upper shadow and closing at the lower shadow.
.png)
Now, what we see on a price chart of a cryptocurrency is a collection of bullish and bearish candles. This makes a candlestick chart. Thus, a candlestick chart is a graph-like structure made up of several candlesticks based on the price movements of an asset.

What we mean by candlestick patterns, are those particular price movements on a candlestick chart that make it easy to predict how the market is going to move next. Due to this, these patterns are used as a tool in the financial analysis of an asset. There are so many existing candlestick patterns and each of them indicates a particular movement might occur or give some more insight into the current situation of the market.
These candlestick patterns are a very useful tool in trading analysis. The benefits are many and include the following;
- Candlesticks are formed by price fluctuation of an asset in the market and gives a more grouped look, gathering all possible price movements and plotting them in an easy to comprehend way.
- Candlestick patterns are easy to understand and recognize on a chart.
- These patterns give more insight on who has control of the market at any given time, whether it is the buyers or the sellers.
- Unlike other charts, these convey more information on the interchanges between the buyers and the sellers in the market within any given time.
- It is easy to recognise whether the market at the moment is bullish or fetish just by looking at the length and colours if the candlesticks.
- Candlesticks patterns help us to easily identify the direction of a trend in the market and important market points.
b) In your own words, explain the psychology behind the formation of the following candlestick patterns.
There are so many different candlestick patterns used in trading. But I shall elaborate more on the following five.
Bullish Engulfing Candlestick Pattern
Firstly, what is an engulfing candlestick pattern? It is a candlestick pattern that is made up of two candles, where the second candle completely covers the previous candle. So the second candle has engulfed or swallowed the first candle.
So now what is a bullish engulfing candlestick pattern? It is a type of engulfing pattern whereby the first candle is a bearish candle and the second is a bullish candle. Thus, a bullish engulfing candle pattern is one in which a bullish candle completely shrouds a bearish candle. This bullish candle closes higher than the bearish candle's open and opens lower the bearish candle's close.
When it occurs in a downtrend, it means that the buyers are now in control of the market. This is almost always accompanied by a complete reverse in the trend and direction of the price.

Doji Candlestick Pattern
Doji candles are special candles which are made up of just a vertical line showing high and low price and a horizontal line showing opening and closing price. It has no body. This is because there is uncertainty in the market and neither the buyers or There are three types of Doji candles namely; the dragonfly doji, the long-legged doji and the gravestone doji.
- Dragonfly Doji: This doji candle is characterized by having it's horizontal line (opening and closing price) at the top of the vertical line. It looks like a capital letter T with a longer tail. This particular doji is a bullish reversal pattern. That is, when it occurs in a downtrend, it gestures a price reversal.
- Long-legged Doji: This doji has it's horizontal line halfway between the high and low price. And this doji can signal a reversal in price. But it is not certain as sometimes after it's occurrence, there is no change in the price direction.
- Gravestone Doji: This doji has its horizontal line at the bottom of the vertical line. Whennn it occurs in an uptrend, it suggests a reversal in price. This is because it is a bearish reversal candlestick pattern.
It should be noted that these patterns are formed in a period of indecision in the market. So to minimise fake outs, trading should be done only after the next proper candle has been formed.

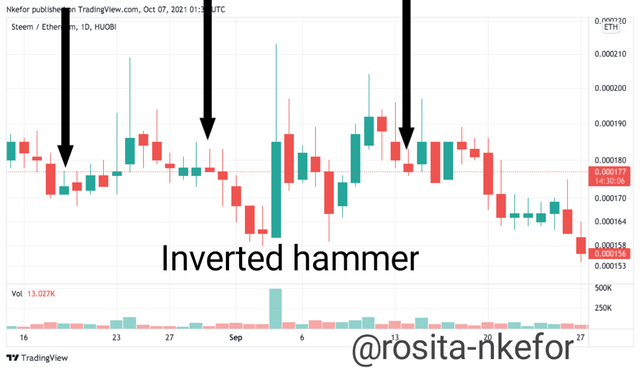
The Hammer Candlestick Pattern
This is a candle that has a shorter body and a very long wick below, giving it the image of a hammer. Here, the closing and opening price is almost the same. This candle shows that the price is strongly being opposed by the buyers. It is very significant in that if it occurs at a support level in the market, they can suggest a strong reversal in price. This is the bullish hammer.

You also have the inverted hammer. Now this hammer has it's wick going up rather. This is because the price is instead being strongly opposed by the sellers pushing it downwards. It is important in that when it occurs in an uptrend, it suggests a strong price reversal. This is the bearish hammer.
The Morning and Evening star Candlestick Pattern
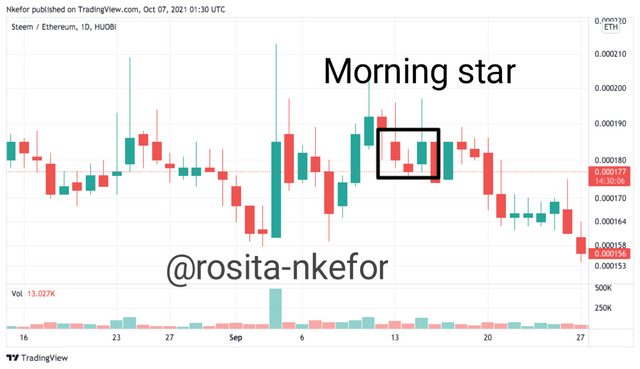
The star candlesticks patterns are made up of three candles. It is of two types; the morning star and the evening star.
- Morning Star Candlestick Pattern: This is the bullish star candlestick pattern. Here, the first candlestick is a strong bearish candle I.e sellers are in control. The second candlestick is a now a small Doji candle i.e sellers can not push price down again. Then the third candlestick is a bullish candle that engulfs the Doji i.e buyers are now in control.
So basically, the sellers were in control and then the buyers took control over the price. When this pattern occurs in a downtrend, it signifies a very strong reversal in price. The signal given by the pattern is strongest when it occurs at a support level. It can be inferred that it is called the morning star because from this pattern, price generally rises.
- Evening Star Candlestick Pattern: Now this is the bearish star candlestick pattern. Here, the first candle is a strong bullish candle I.e buyers are in control. Next, you have a small Doji indicating that the buyers are losing their strength and power in the market. The third candle is now a long bearish candle, which engulfs the small Doji I.e the sellers are now in control.
So it means that the buyers were in control of the market until the sellers took the control. If this pattern occurs in an uptrend, it indicates a strong reversal in the price. The signal here is stronger at a resistance level. So you can infer from it's name evening star that the price is about to fall down.

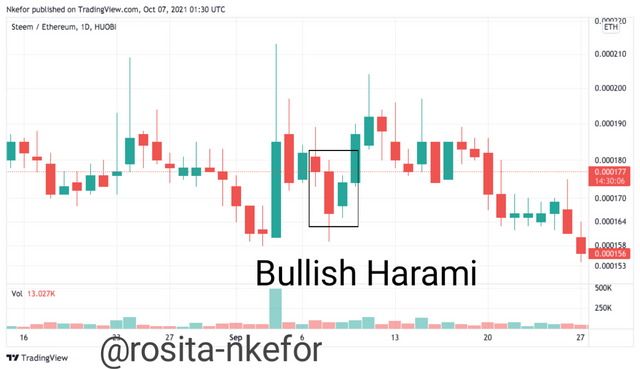
The Harami Candlestick Pattern
This candlestick pattern is made up of two candles. Here, the second candle is smaller than or enclosed by the first candle. So we see that this pattern is completely opposite to the engulfing candlestick pattern.
This pattern generally occurs when the buyers and sellers are fighting for control in the market. This makes this candlestick pattern show uncertainty and indecision in the market.
Like all the other candlestick patterns, we have two types here namely the bullish harami and the bearish harami candlestick pattern.
- Bullish Harami: Here the first and longer candle is bearish while the second smaller candle is a bullish candle. So a bullish candle is enclosed by a bearish candle completely. When it is formed in a downtrend, especially at a main support area, it indicates a strong reversal which is bullish.
- Bearish Harami: The first candle here is bullish while the second is bearish. So, the bearish candle is enclosed by the bullish candle. When it occurs in uptrends specifically in strong resistant areas, it suggests a strong reversal in price which is bearish in nature.
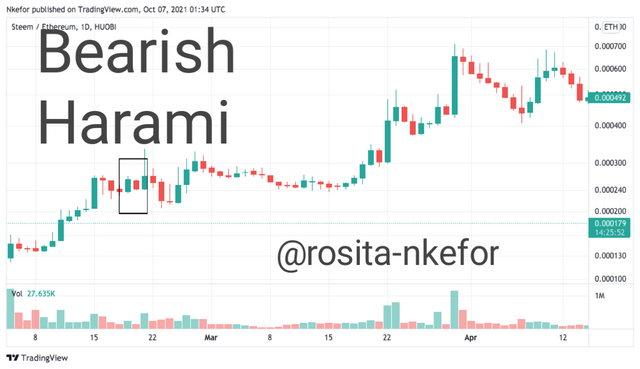
A special thing about the Harami candlestick pattern is that if it occurs in the middle of a trend, it willl rather suggest continuation of that trend.
Conclusion
Candlesticks patterns are very important for every trader to know because they convey a lot of information on the way the price of an asset is moving in the market. Understanding these patterns will help us understand charts way better and is very important when using the price action strategy.
Thank you for reading.
NB: All photos were screenshotted from https://www.tradingview.com/ and edited using Photogrid.