Steemit Crypto Academy Season 3 Week 2 - Beginner's Course | For Prof @reminiscence01: Introduction to Charts
Hello,
I salute all colleagues and professors in the Cryptoacademy.
Learn from professor @reminiscence01, is a great opportunity
Question
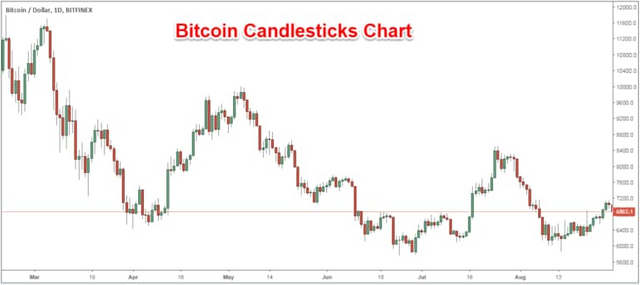
1.) Explain the Japanese Candlestick Chart? (Chart screenshot required)
Candlestick charts are the most common style of chart used in technical analysis in the cryptocurrency market.
Each candlestick depicts the price movement over a specific time period.
The opening and closing prices, as well as the highs and lows, are the most important aspects of each candlestick.
This chart is one that I frequently use since it is the most visually appealing and provides the most valuable information for me on the dynamics of the cryptocurrency's market value.
The chart type, I mean the Japanese candlesticks will provide the most graphic picture of the market situation.
The prices in rice commerce in Japan in 1700 were forecast by Munehisa Homma. But in the early 20th century Charles Henry Dow evaluated it better
The difference between current price values and the optimal values for buying and selling an asset on the stock exchange is analyzed using Japanese candlesticks.
When a candlestick's closing level exceeds its beginning level, the candlestick is said to be bullish and turns white or green. However, if a candlestick's closing level is lower than its initial level, the candlestick is deemed bearish and is colored red or white.
Candlestick shadow tips, or the tip of the lines that move away from the candle, indicate the presence of lows and highs in the market.
Below is an example of a Japanese candlestick chart:
Even the shadow of a candle might provide useful information to a trader. Be it long or short shadow, it implies a high level of uncertainty and severe volatility among many market participants.
Question
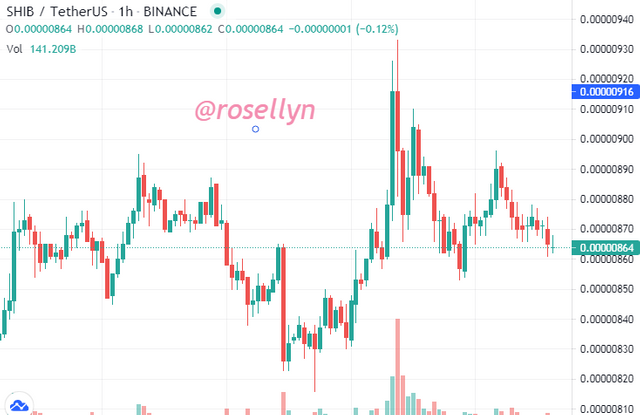
2.) Describe any other two types of charts? (Screenshot required)
Bar Chart
With this style of chart, we see bars. Each of these vertical bars indicates one of the graph's time periods.
We can see the price at which the asset was opened, as well as the highest and minimum prices for a certain period of time, on the bar chart in addition to the closing price.
The bar is a vertical line as earlier said, with the highest point indicating the highest price and the lowest point indicating the lowest price. There are serifs that run horizontally from the vertical line. The open price is shown on the left serif, while the close price is shown on the right serif. If the left serif is greater, the asset's price has decreased; if it is higher, the asset's price has is going higher
This graph have different colors. The column is green if the price at which the asset opened is lower than the price at which it closed (Uptrend). When an asset's opening price is higher than its closing price, the column turns red (downtrend).
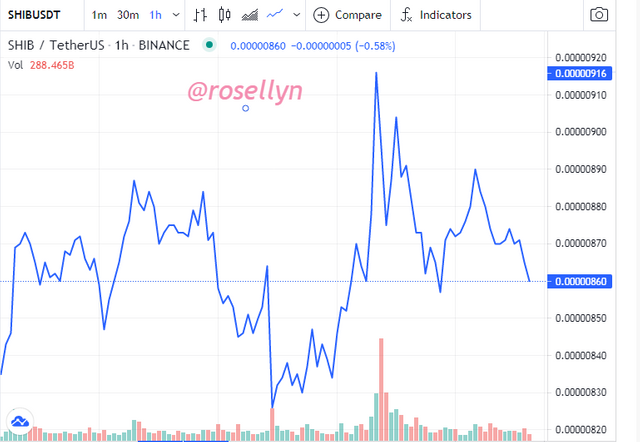
Line Chart
The line chart is the most basic type of market chart.
This style of graph is used to gain a sense of how the crypto price has changed over time, by a line.
The price chart is based on the daily currency closing price.
The point on a technical analysis of line chart is the timeframe's closing price.
Each time frame begins with a point on the chart representing the most recent price of the interval, followed by a line connecting all points together to give a reasobale presentation
Question
3.) In your own words, explain why the Japanese Candlestick chart is mostly used by traders.
The main reason why traders use the Japanese candlesticks chart is that it displays the starting and closing price for a specific time period, which helps them understand what has happened in the past while forecasting what will happen in the near future. This will assist in achieving quick results while requiring less stress.
Other factors include:
The candlestick is used to identify possible trend completion or correction points.
Trend reversal points can be found on candlesticks.
Traders can easily open trades with near-perfect precision.
Traders can use it on desired timeframe they like, from a minute to a week, or even longer.
The Japanese candlestick is far more visually appealing, and the color indicator makes it easier to read.
Question
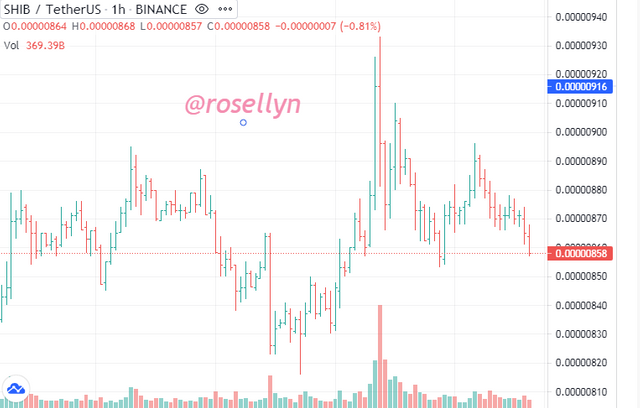
4.) Describe a bullish candle and a bearish candle identifying its anatomy? (Screenshot is required)
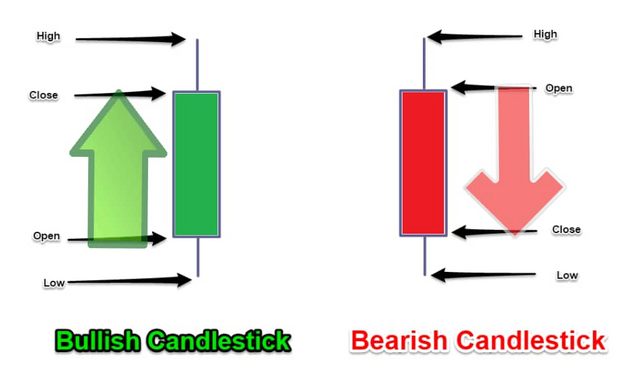
The body of a Japanese candlestick is usually green (white) or red (Black). The color indicates whether the trend was bullish or bearish; whether the closing price was higher (green, bullish) or lower (red, bearish) than the opening price for a certain time frame within the selected time.
Both the bullish and bearish candles have the same overall architecture.
The price's lowest position at a certain time; the price's minimal value.
The highest point in price at a certain period; the maximum price value.
The closing price is the price at which the movement of the candle (price) comes to an end at a specific moment, which usually occurs before a shadow.
The opening price is the price at which the movement of the candle (price) begins at a specific time, which usually happens after a shadow.
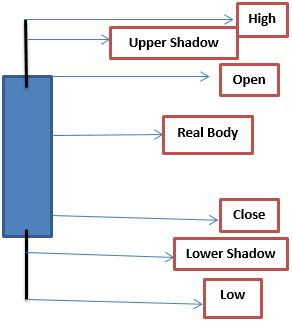
The remaining sections of the candlestick are as follows:
The starting and closing prices for the defined time period constitute the candlestick body; the gap between the open and close price in a certain timeframe.
The distances between the body and the high and low of the candle indicate the mood of the trading participants; the shadow is that which extends from the body and reflects the mood of the trading participants.
Conclusion
The use of Japanese candlesticks is marked by known advantages.
Because of the dependability of these aspect, it makes it easy to look into the pricing rather than mathematical calculations.
Candles can be used in many different ways.
They can be used on asset charts from all markets.
Novice traders, on the other hand, may find it challenging to master them. It is beneficial to put in some effort and time to fully comprehend candlestick analysis.
Hello @rosellyn, I’m glad you participated in the 2nd week of the Beginner’s class at the Steemit Crypto Academy. Your grades in this task are as follows:
Recommendation / Feedback:
Thank you for performing this homework task.