Steemit Crypto Academy | Season 2: week 7 - The Swing trading style
Hello fellow steemians,
Before we move further, it is well understood that Swing Trading is a style of trading that involves holding a trade for a longer period than a day trade, but not as long as long term investment. In this style of trading, a trader can hold a trade for a few days, weeks or even months. the trading involves studying and analysing many different time frames inorder to determine the near perfect entry and exit strategies.
Due to the regular increase and decrease in stock prices, the crypto market prices are always zigzag-like. The troughs and valeys of these curves are what swing traders use to analyze before making a trade. In the troughs, where we have relatively high values of highs and lows, we call it the uptrends. Downtrends refer to periods where we get relatively lower prices of highs and lows.
As discussed in his lecture, Prof @yohan2on did make it clear that in swing trading, the trader makes use of technical analysis techniques like the japanese candlesticks, chart patterns, moving averages, indicators, etc. The trader will then develop a strategic plan to discover good entry and exit points. The swing trader may also make use of some fundermental analysis in addition to the technical analysis to make high probability and accurate trading decisions.
This assignment will duel much on the use of technical analysis to illustrate cryptocurrency pairs in swing trading.
Technical Analysis: Swing Trading on BTC/USD pair:
I have chosen to swing trade on the BTC/USD pair since I find it easier to explain using most of the technical analysis tools. For this, I will use tradingview.com because it contains helpful tools to make things easier and less stressful when studying trends in the market.
The technical analysis tools used in this post include candlestick analysis, chart patterns, technical indicators, and multi-timeframe analysis. this will help us easily determine our entry and exit strategies.
My Trading Plan:
As a swing trader, you cannot choose an entry and exit point right away. You have to study and understand the trends on the market. The trend shows you the nature in which the market moves.
Multiple Timeframe Analysis:
This is a very important tool in choosing a trading plan. It helps to discover the market trends ranging from high timeframe to low timeframe. In swing trading, monthly, weekly, daily and even hourly timeframes are all employed in finding the most probable point of support and resistance levels. The hourly timeframe(usually 4hrs and 1hr timeframe) are perfect for knowing exactly the nearperfect entry point for trading.
Candlesticks Analysis:
With this type of technical analysis, we can use it to determine the market trends and possible reversal patterns. These are done by noting the levels of higher highs and higher lows, and also lower highs and lower lows. This tells us whether our chart is moving in an uptrend or downtrend. if in an uptrend, we buy and if in a down trend, we sell. One way to note an uptrend is that, a higher low must not fall below the preceding higher low(or the preceding lower low).
A downtrend is opposite, such that the preceding higher low is higher than the succeeding lower low. After we identify the market direction, hammers, doji candles, and other candlestick patterns indicating the support and resistance levels can help us establish a possible entry strategy.
Technical Indicators:
the indicators used in this post are rsi and macd indicators. The rsi indicator is considered by most traders as a reversal indicator, when actually, it is a momentum indicator. It tells us when a price has been moving in a certain direction for a long period of time. Most traders usually think that when the market price is above 70, that means that it's time to sell, in order to look for a possible reversal period and that when the price is below 30rsi however, that means it's time to buy. Well, this may work out sometimes, but combining this with other technical factors is mostly a losing strategy.
Analysis On BTC/USD in Coinbase:
Monthly Chart
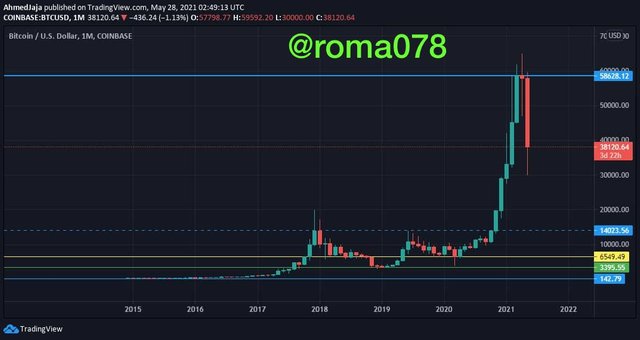
Considering the monthly Chart above, there has been an uptrend starting from around March 2017 until it reached a resistance level in December 2017 at a price of 14023 US.D. The price had decreased afterward to 3395 US.D in February 2019 but with a high low than the previous low price in 2017. from the chart, there's an apparent uptrend in the market price in the few months between March 2019 and June 2019, followed by a gradual downtrend since July till March 2020. In March 2021, we saw a very rapid increase in price since it's first promising uptake in December 2017.The tremendous breakout in March 2021seems to be fake and misleading because the next two candles have markedly moved down towards a support at 14023USD before a possible reuptake in prices.
Using the fibonacci retracement on the monthly Chart, we can observe the 0.5 level of the retracement to be the exact stage of the rapid downtrend. Currently, we see prices going towards the 0.618. The two levels 0.5 and 0.618 are considered major reversal level detectors. From the diagram, prices are most likely to continue downtrend towards the resistance level of 14023usd, which may serve as support for reuptake.
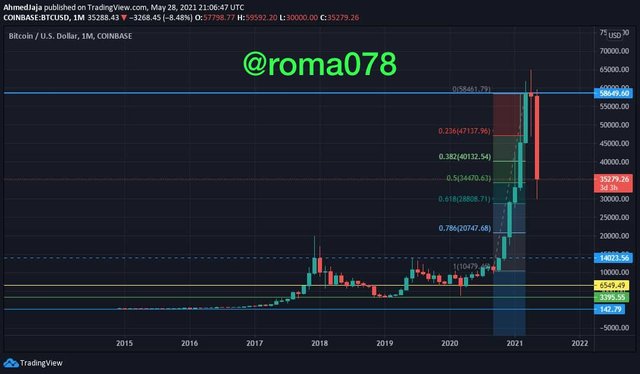
Weekly Chart
Considering the weekly Chart, we can notice the continuous decrease in price levels towards the 19522resistance levels.Yhis level may serve as either resistance and support for the reverse growth of prices.
Using the fibonacci retracement on the weekly Chart, it is apparent the prices are heading downwards, towards the 0.5 retracement level. Price has rejected the 0.5 fibs level, and most probably to the 0.618 fibs level.Prices are likely to hit the 0.786 level and retest the support level at 19107usd. The weekly Chart information is not always enough to help us determine an entry position. The daily chart does better in this.
Daily Chart
On the daily chart,there was an initial uptrend before the downtrend. At this point, one can start searching for strong support and resistance stages.
4 Hour Chart
In swing trading, using the 4hr chart is a better option to help one enter a trade at very good entry strategies. The 4hr chart of the swing trading style is comparable to the 1hr chart of the day trading. When the market trends are upward, you can find your stoploss manually at the bottom of every higher low. You can also find the stoploss at the top of every lower high for a market in a downtrend. The current trend is a downtrend, heading towards below the resistance which may turn support at 14023usd. Which means I can possibly set my stoploss at around19522 to 25000.
RSI signals are more dependable when the trade spans for longer periods. it is an oscillator that have values reading from 0 to 100. The 70 and 30 rsi levels are the most important points to consider when using rsi indicator. When the rsi goes into the 30 zone, it means the market is oversold, indicating a good time to buy because from this point, prices are most expected to rise in the next few hours/days. In contrast, when the rsi enters the 70 zone(overbought), it signals a good time to sell, since the prices are very much expected to decrease afterwards. The rsi shows our bullish and/or bearish divergence(which do not occur frequently) to help in increasing the chance of finding good entry and exit points. However, these indications are only predictions, and not exact all the time. As a trader, you need to be tactical and have patience (which most of us do not have). RSI at the 50 means that the price of btc is average within this period.
Trade Management (Setting stop loss, trailing stop and take profit)
From the rsi indicator in the chart below, it indicates I can fix my stop loss at around 33515usd and enter into trade/buy btc when it goes above the 36858usd. My take profit will be at around 39334usd. Being an expert in analysing the market trends does not always guarantee you will make a correct entry decision. Nonetheless, knowing when to enter and leave trading based on facts will give you an advantage of never making too much losses.
Swing trading is the perfect trading style for me because I don't really have to continuously look into my chart every single time since I'm quite busy most of the time. Market trends are never constant, so you need to analyze how prices are moving to be able to make more informed decisions. You always need to plan and be patient as well.
Thank you very much Professor@yohan2on for the enlightening lecture on Swing trading as another style of trading. Your lecture has vastly increased my knowledge on this topic.