Crypto Academy Week 12 - Homework post for Professor @kouba01 - Cryptocurency Trading with RSI
Hello Everyone,
im glad for this week lecture, i have gone through it and learnt it. hopefully i can provide the best work in this week assignment. Thank you @kouba01 for the lecture.
lets get started...
Question 1.
Relative Strength Index is a tool and an indicator which help traders to make technical analysis of stock which reads the magnitude of price changes. It helps an individual to make almost perfect time to enter and exit from the market. Traders make profit from the market when they are able to make a good entry and exit thus buying low and selling at high price.
Relative Strength Index indicates an overbought or oversold stock or cryptocurrency. It ranges from 0 - 100, When its below 30 it shows the market is oversold(prices fallen unexpectedly) and also when its above 70 it shows the market is overbought(prices risen unexpectedly). This informations the Relative Strength Index shows, we can use it for our day to day trading to our advantage.
RSI can be calculated using the formula
RSI = 100 - (100 /1 + RS)
where RS = Relative Strength = average of U/average of D
Step By Step Calculation
- RS = get your up moves and down moves (U and D)
- Get the average of U and also the average of D
- Now calculate the RS and fix it to the formula
- Calculate your RSI.
Question 2.
The RSI is one of the most used indicators by traders. These traders use it because they have some amount of trust for it not necessary because it give 100% accurate signals. It sometimes fails and provide wrong signals, due to this i suggest every trader to add other options of indicators to their technical analysis to be in the safest side. So to say i will trust RSI 100% i think i will say no but there is a little bit of trust you should give to it because it gives more accurate signals than false signals.
Question 3.
Below is the steps with screenshots on how to configure the relatatibe straight index indicator on a chart.
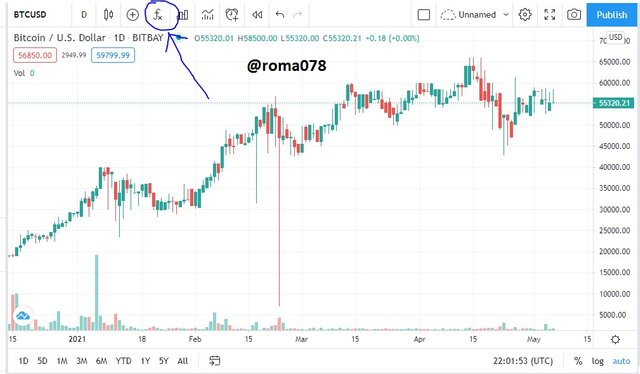
Click I’m fx indicator
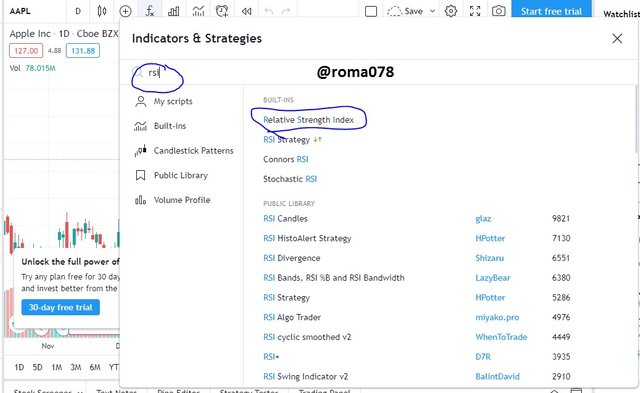
Type RSI in the search box and choose Relative Strength Index
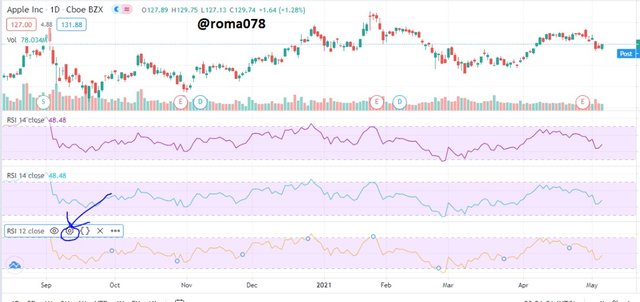
Afterwards click on the settings.
a pop up menu appear containing the input, style and length and the click ok
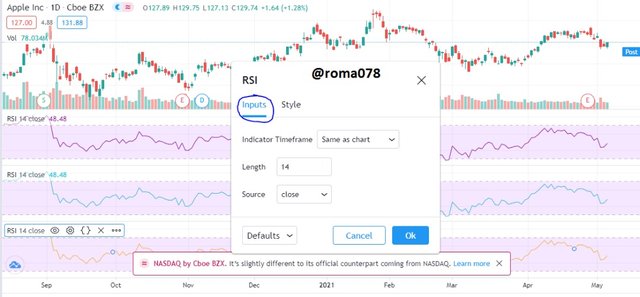
Length Parameter
The relative strength index parameter tells you how stable or volatile relative strength index is and at which rate it will react to the change of market either upwards or downwards.
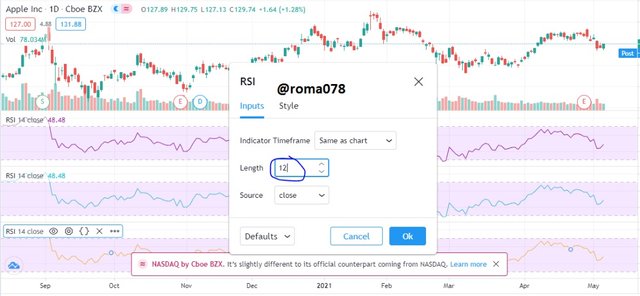
The length is always 14 by default because it is what most traders consider and use. They mostly consider the chart movemen for the last 14 hours, 14 days, etc and ofcause it can be changed to either higher number or lower number. In the screenshot above i did change it to 12. So yes it can be changed.
Question 4.
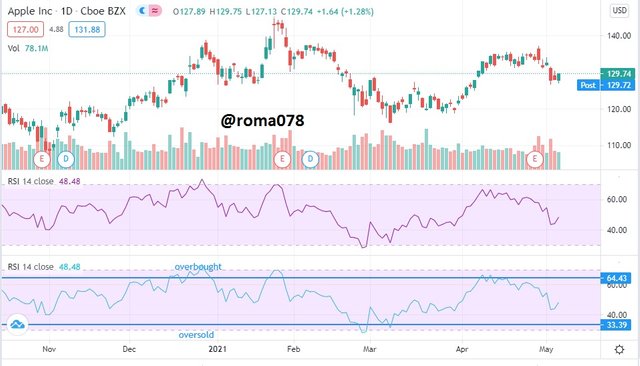
The graph above shows the interpretation on an overbought and oversold signals in trading cryptocurrency. This is interpreted in a range from 0 to 100.
Overbought: This is the extreme movement of price upwards indicating the relative strength index. This movement is usually above 70.
Oversold: This is the vise versa of overbought. It is the extreme movement of of price downwards indicating the relative strength index. This is usually below 30.
Question 5.
RSI gives an indication that something is about to happen to an asset price. Sometimes indicators gives false signals and as a trader you need to be able to detect a false signal from a true signal.
To be able to filter a false signal from a true signal in RSI is to combine it with other indicators to see if both give the same signal. If it does then its a confirmation of the signal.
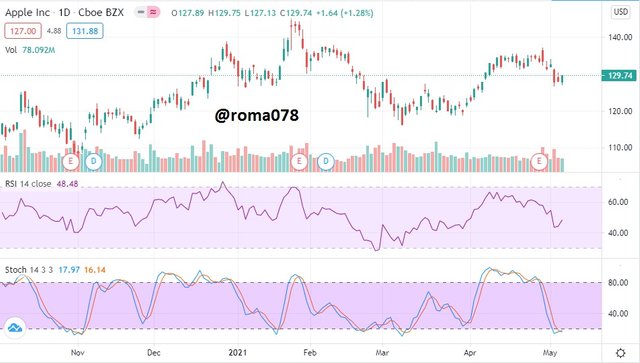
We can see from the above graph both the indicators are showing a reversal of the price which confirms the results from the RSI indicator.
Question 6.
There are alot of indicators a trader can capitalize on. and we can see alot of them in the graph indicated with arrows and symbols.
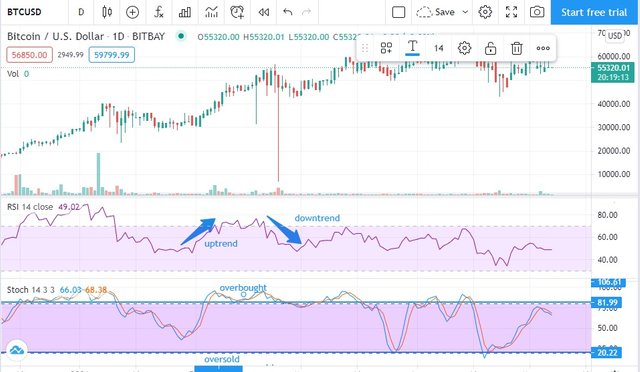
We have in the graph uptrend, downtrend, overbought, oversold, etc. Uptrend is when the price goes up and down trend is when the price goes down. overbought is when the price goes up over the 70 mark, this is best time to sell to make profit. Oversold is when the price goes down below the 30 mark, this is the best time to buy into the market. This all can be seen in the graph provided.
The fluctuation of the stock market makes it difficult for traders to analysis the market to make the right decisions. RSI is a tool that help to read the market a step ahead to be able to make these right decisions to our advantage. It is advised to try to filter the false signals using other methods. It is not 100% accurate so there is the need for confirmation with other methods and tools.
Hi @roma078
Thanks for participating in the Steemit Crypto Academy
Feedback
This is just average content. Kindly put more effort into your work. You had to avail more time to your work so that you provided a more detailed article about the RSI trading indicator.
Homework task
5