Crypto Academy Season 4 | Intermediate course by @allbert –week 3: Trading with Contractile Diagonals.
Hello Everyone,
Today I come your way again with yet another solution post. I very much enjoyed Professor @allbert's lecture which was on Contractile Diagonals and details related to it. In this post, I shall try my best to answer the questions given at the end of his lecture. I hope the information you find here is as enlightening as you anticipate.
Q1. Define In Your Own Words What A Contractile Diagonal Is And Why It Is Important To Study It. Explain What Happens In The Market For This Chart Pattern To Occur:
Contractiles Diagonales (in Spanish) is one of many chart patterns that occur in our regular trade charts. It occurs in many instances during price movements. One may as well refer to it as a wedge and not be wrong as far as it's role remains unchanged. It is as a result of two diagonals that can be drawn to connect the peak points of a wavelike pattern. It is a trend reversal pattern which I'll explain. The pattern can indicate a bullish trend or a bearish trend. A rising contractile diagonal is formed in a bearish reversal pattern and indicates an uptrend whereas a falling contractile diagonal is formed in a bullish reversal pattern.
The wave pattern of this contractile diagonal posseses striking similarities to the Elliot wave pattern in that it has the 1-2-3-4-5 wave structure. The numbers represent peak points on the wave in the price pattern on the chart. Like in the Elliot wave, the 1,3 and 5 points seem to serve as the impulses and are connected together by one straight/trend line/diagonal. The other trend line connects the peak points 2 and 4, which are considered the retracements. The diagonals are drawn/plotted in such a way that they converge a little after the end of the trend if they should be extended. The wedge forms as a result of the contraction/constriction of price candlesticks in the chart. For more explanation, consider the image below. It shows a Contractile Diagonal pattern in which we can find a wave of points labeled 1,2,3,4 and five. The points 1,3 and 5, collectively referred to as the impulses are connected by one of the two diagonals. The retracements 2 and 4 are connected by the other trend line. The nature of the trend lines serve as the support and resistance as you would see in any trend. The impulsive trend line would act as the resistance while the retracement trend line would be the support for the market prices. From the image, we can also clearly see that the two lines will meet/converge at a point in the near future of the price movement. The price always breaks the retracement line after the 5th point.
The Importance of Studying Contractile Diagonals is such that they help predict the trend of a market, thus, helping traders to know when to make trades for higher profits. The Diagonals are also helpful in calculating the possible entry, take profit and stop-losses for effective trading.
The pattern occurs in a market to predict a trend in the opposite direction. That is to say, when a trend in a specific direction say an uptrend has remained in the market for a long while, the trend becomes weak and exhausted. At this stage, the market trend breaks into the retracement diagonal and goes the opposite trend.
Q2. Give An Example Of A Contractile Diagonal That Meets The Criteria Of Operability And An Example Of A Contractile Diagonal That Does Not Meet The Criteria.
The Contractile Diagonal is a major tool traders can use to increase their productivity in trade. To be able to use it however, one must be able to identify the pattern correctly and not mistake it with several other types of patterns that may occur in a chart. So in order to correctly find a wedge pattern, one must look out for the following features/criteria:
Wave point 1 must be longer than wave point 3
Wave point 5 should be shorter/smaller than wave point 3
Wave point 2 should be longer than wave point 4
The two tend lines must seem to converge and meet at a point little beyond wave 5
The impulsive trend line must touch wave points 1 and 3 and should not be far from wave point 5
The retracement line must touch wave points 2 and 4.
Example of a Contractile Diagonal that meets the criteria
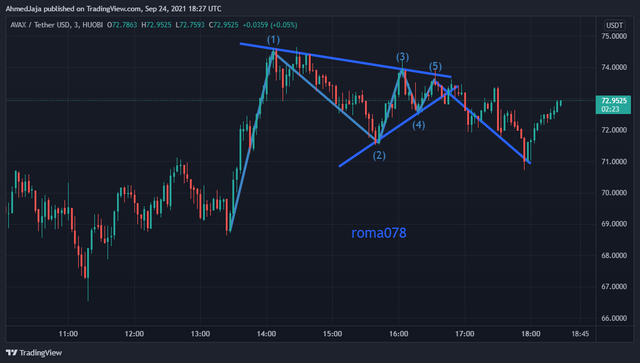
From the 3minutes AVAX/ Tether USD chart above, it is apparent we have a good scenario of a proper contractile diagonal pattern. This is clear to see that all the important rules are attained. That is, we can see obviously the wave 1 is longer than wave 3, and three larger than 5. The first diagonal passes through points 1 and 3 and within the vicinity of wave 5. The second diagonal passes through points 2 and 4. Wave 2 is longer than wave 4, and the two trend lines appear to meet a little from wave 5.
Example of a contractile diagonal that does not meet the criteria
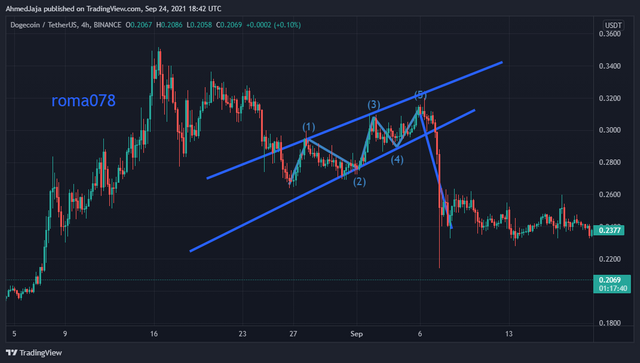
In the image from tradingview above of a 4hr DOGECOIN/TetherUS chart, we can clearly see the breaches of some of the rules for a Contractile Diagonal. Wave 3 is more prominent than wave 1. Also, the two trend lines do not seem to be meeting any point near the wave point 5. Hence, it does not qualify as a contractile diagonal pattern.
Q3. Through Your Verified Exchange Account, Perform One Real Buy Operation (15 USD minimum) Through The Contractile Diagonal Method. Explain The Process And Demonstrate The Results And Graphical Analysis Through Screenshots. Your Purchase Data must Match Your Analysis Data: such as Cryptocurrency and Entry Price:
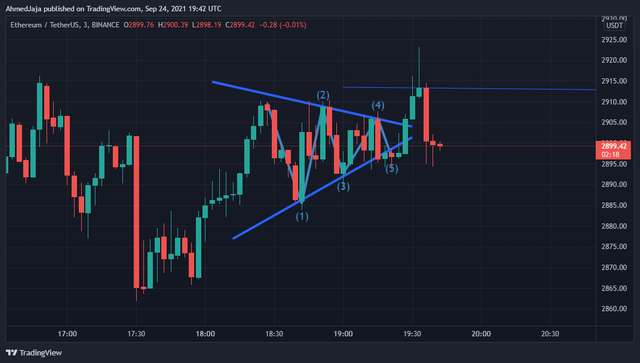
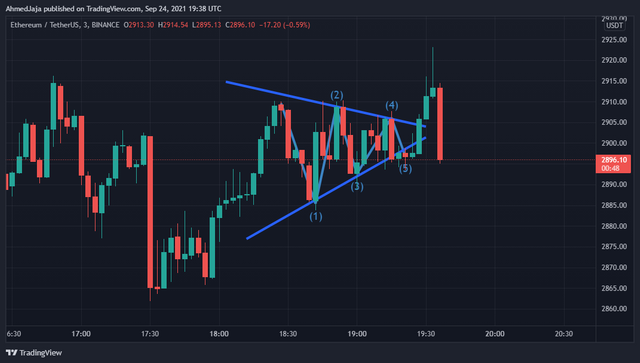
For this operation, let us use the Ethereum/TetherUS pair. Below in the image, it have identified my contractile diagonal pattern that meets the criteria. The two diagonals are seen to converge at a nearby point with wave 1 being more prominent than wave 3, which is more prominent than wave 5. We can see the break out above the retracement after wave 5 as well. Here, I put my entry level at 2906.00, a stop loss at 2899.50. A take profit at 2911.00 shows a R/R ratio above 1 which is good.
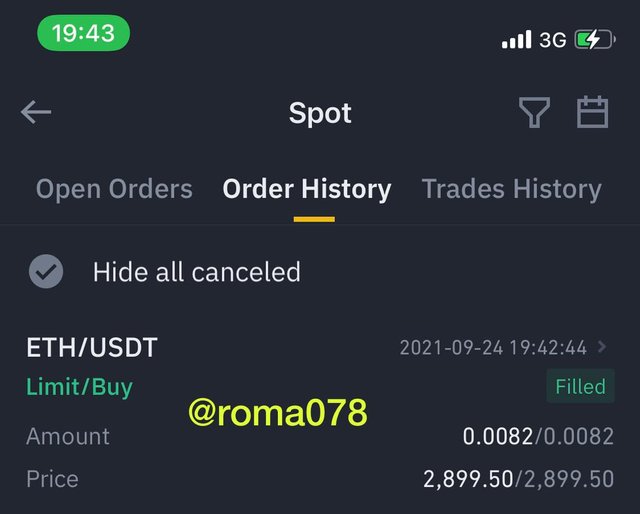
The image below shows my purchase history. A higher take profit to stoploss ratio indicates I have made profit from my trade.
Q4. Through A Demo Account, Perform One Sell Operation Through The Contractile Diagonal Method. Explain The Process And Demonstrate The Results And Graphical Analysis Through Screenshots. Bitcoin Is Not Allowed:
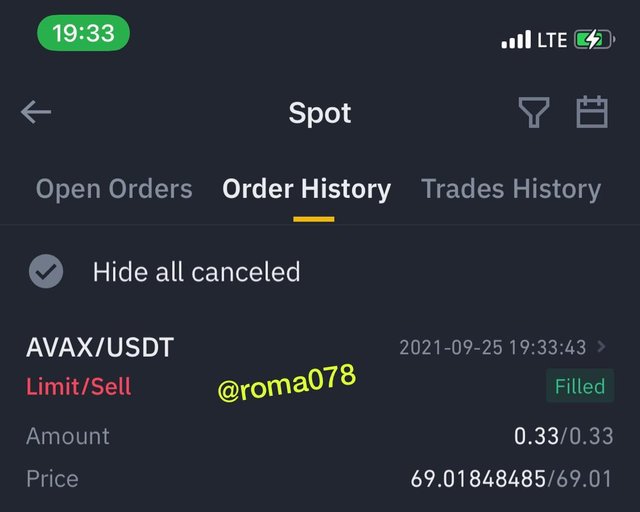
By looking out for the right contractile diagonal pattern in the market,I chose to trade with the AVAX/TetherUS pair. As seen in the screenshot below, after the fifth wave, the trend in market prices is expected to move down towards breaking the retracement trend line. I entered a sell order following this acknowledgment. My stoploss was set at 75.00 USDT and my take profit at 40.00USDT.
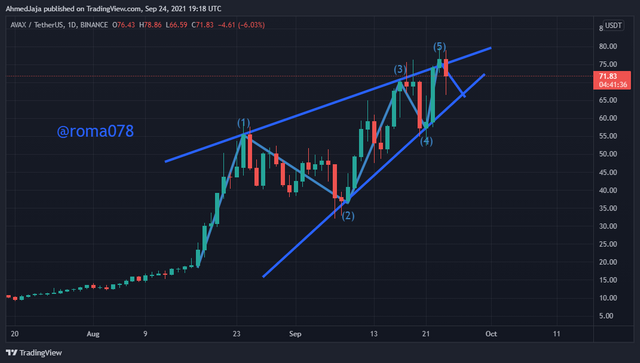
The below shows the screenshot of my sell offer.
Q5. Explain And Develop Why Not All Contractile Diagonals Are Operative From A Practical Point Of View.(Screenshot Required/BTC Not Allowed):
In some cases, despite the fact that a certain pattern may possess all qualities/features as mentioned earlier, it is not always enough to predict the nature of the market trend as the prices move forward. For example, in the image below, it is clear that the pattern drawn out us a typical contractile diagonal pattern with the traditional 1-2-3-4-5 wave structure. However, you'll notice that after the fifth wave where it is expected to continue a sharp Uptrend to break the retracement trend line, it rather spends a short time and then moves in the opposite downtrend direction. This serves as a risk to traders especially when setting their R/R ratio for productive trade entries.
The contractile diagonal patterns are obbe of the many technical analysis indicators used by traders for detecting and analyzing market charts. It is quite similar to the Elliot wave pattern with the 1-2-3-4-5 wave structure. It is used to predict future trends in a market so as to better identify profitable market entries and exits. A pattern is considered a Contractile Diagonal pattern if only it meets certain criteria as mentioned above.
However, as established, there are some practical scenarios where a pattern meets most of the criteria, yet does not qualify to be used as a contractile diagonal method.
That is it guys. This is my post to Professor @allbert's lecture on Contractile Diagonals Method and I do hope you enjoyed reading it. Thanks for staying around and spending your time with me. Till next time, I wish you the best of luck in your endeavors.