Steemit Crypto Academy Temporada 03 - Semana 02 | Estrategia de ruptura de la estructura de mercado (MSB) para reversiones comerciales por @rogegonz
Steemit Crypto Academy Temporada 03 - Semana 02 | Estrategia de ruptura de la estructura de mercado (MSB) para reversiones comerciales por @rogegonz
Hello to all cryptocurrency lovers and especially to the new teacher @criptokraze for me it is a pleasure to be able to participate in this second week of the third season of the #SteemitCryptoAcademy I am fascinated with the new thing that I am learning and I find it interesting. This task is based on the teacher's practice, because if it is useful for him, it will be useful for us. Next I will be answering all the questions regarding the investigation, thank you!

1 - ¿Qué entiendes sobre estructura de mercado?
Ahora vamos a comprender un poco más la estructura de mercado alcista y la estructura de marcado bajista de acuerdo con los cambios de precios, los mínimos y máximos de oscilación que se genere, el zigzag que forme y las velas generan la estructura de mercado.
The market structure is the way the market moves and for them there are 3 ways, either uptrend, downtrend or lateral. The market moves in the form of a zigzag depending on how the price movements are going, the zigzags that are generated by means of the candles when the price changes are those that determine the trends according to the minimum and maximum of oscillation that As they are presented, those candles that are generated mark the structure of the market.
Now we are going to understand a little more the bull market structure and the bearish marking structure according to the price changes, the minimum and maximum of oscillation that is generated, the zigzag that it forms and the candles generate the market structure.
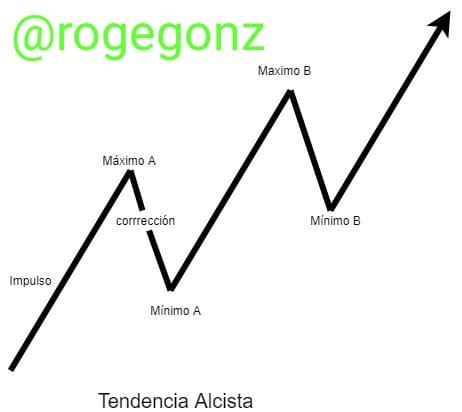
Tendencia alcista
Está tendencia se da cuál el precio se va en aumento, generando máximos y mínimos más altos que los anteriores, de esa manera se genera un zigzag de forma ascendente lo que le da a la estructura de mercado una tendencia alcista.
This trend occurs when the price is increasing, generating higher and lower than the previous ones, in this way a zigzag is generated in an upward way, which gives the market structure an upward trend.
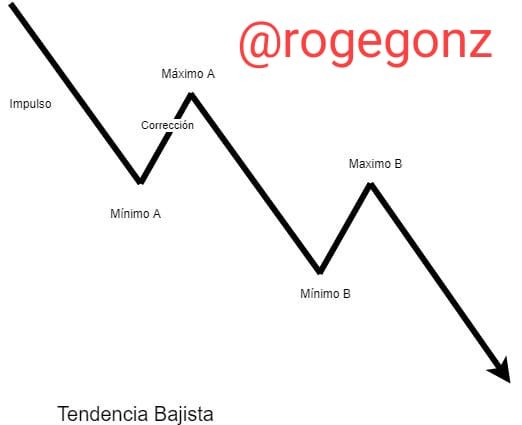
Tendencia bajista
Está tendencia se da cuál el precio se va en decadencia, generando mínimos y maximos más bajos que los anteriores, de esa manera se genera un zigzag de forma descendente lo que le da a la estructura de mercado una tendencia bajista.
This trend occurs when the price is declining, generating lows and highs lower than the previous ones, in this way a zigzag is generated in a descending way, which gives the market structure a downward trend.
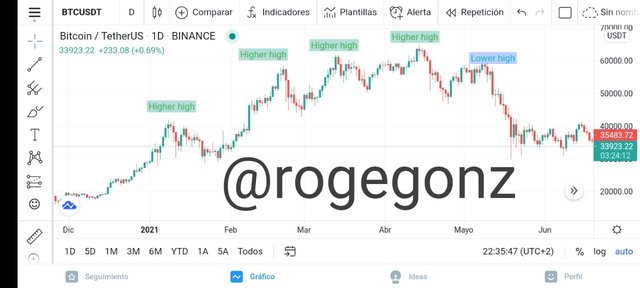
2 - ¿Qué entiendes sobre Lower High y Higher Low? Proporcione ejemplos de gráficos de activos criptográficos.
Para comprender un poco más la estructura de mercado debemos tener en cuenta que las tendencias no duran para siempre, por ende debemos entender que existe un máximo más bajo en una tendencia alcista, para identificar al Lower high debemos saber que es un Swing Más bajo en los máximos y mínimos anteriores. Para comprenderlo un poco más lo señalaré en un gráfico de tendencia alcista.
To understand a little more the market structure we must take into account that trends do not last forever, therefore we must understand that there is a lower maximum in an uptrend, to identify the Lower high we must know that it is a Lower Swing in the previous highs and lows. To understand it a little more I will point it out on an uptrend chart.
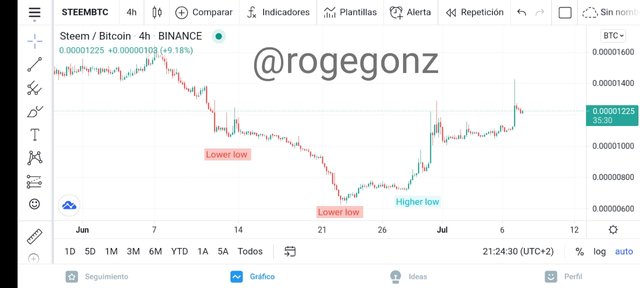
Higher Low
Cómo ya deben saber las tendencias no duran para siempre y lo mismo sucede con las tendencias alcista por ende existen un punto llamado higher low que es un mínimo y un máximo mayor que los mismos y máximos anteriores, puede ser el fin de la tendencia bajista, para comprenderlo más voy exponerlo en una gráfica de tendencia alcista.
As they should know, trends do not last forever and the same happens with upward trends, therefore there is a point called higher low that is a minimum and a maximum greater than the same and previous maximums, it may be the end of the downtrend, To understand it more I will expose it in an uptrend graph.
3 - ¿Cómo identificará la reversión de tendencias de manera temprana utilizando Market Structure Break? (Se necesitan capturas de pantalla)
How did the professor @cryptokraze not explain them, markets are not always the same, therefore there are changes in trends and laterality, but if we clearly study the market structure we can determine a point where a trend can change and agreed with our strategy we can buy or sell in a certain situation. Now I will explain a trend reversal situation.
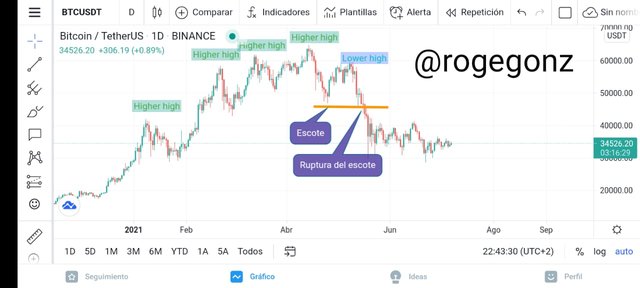
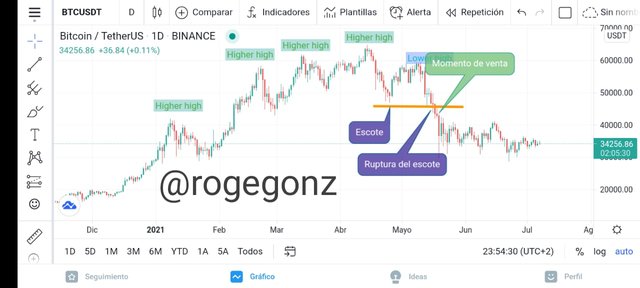
Identificación temprana de reversión de tendencia alcista
Para lograr la identificación temprana de la reversión alcista necesitaré de pasos:
✓ 1. Buscaré el máximo más bajo de una tendencia alcista.
✓ 2. Realizaré un escote (línea horizontal)
✓ 3. Esperaré la ruptura clara del escote por parte de la vela bajista al momento del cierre.
Lo explicaré con la gráfica, con el par de BTC/USDT
To achieve early identification of the bullish reversal I will need steps:
✓ 1. I will look for the lowest high of an uptrend.
✓ 2. I will make a neckline (horizontal line)
✓ 3. I will wait for the clear break of the neckline by the bearish candle at the time of the close.
I will explain it with the chart, with the pair of BTC / USDT
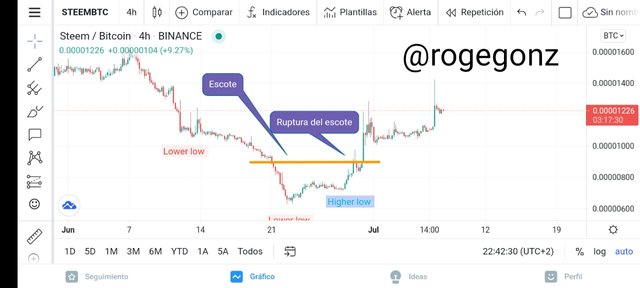
Identificación temprana de reversión de tendencia bajista
Para lograr la identificación temprana de la reversión bajista necesitaré de pasos:
✓ 1. Buscaré el mínimo más alto de una tendencia bajista.
✓ 2. Realizaré un escote (línea horizontal)
✓ 3. Esperaré una ruptura clara del escote por parte de la vela alcista al momento del cierre
Lo explicaré con la gráfica, con el par de STEEM/BTC
To achieve the early identification of the bearish reversal I will need steps:
✓ 1. I will look for the highest low of a downtrend.
✓ 2. I will make a neckline (horizontal line)
✓ 3. I will expect a clear break of the neckline by the bullish candle at the time of the close
I will explain it with the graph, with the STEEM / BTC pair
4 - Explique los criterios de entrada y salida comerciales de cualquier activo criptográfico utilizando el marco de tiempo que elija (se necesitan capturas de pantalla)
Debemos saber que las entradas y salidas de un mercados son super importante comprenderlas si queremos ser profesionales en el trading, como también para lograr maximizar ganancias. Por eso es bueno tener una buena estrategia de entrada y salida.
We must know that the entrances and exits of a market are super important to understand if we want to be professionals in trading, as well as to maximize profits. That is why it is good to have a good entry and exit strategy.
Comprar criterios de entrada
Para la compra de los activos se recomienda que esté en un tendencia bajista, el precio debería estar en un mínimo más alto luego de varias series de mínimos, como podemos identificar en las gráficas de tendencias bajistas, el escote que marcamos con el Higher Low y su ruptura nos podrá ayudar con la decisión de entrar, si tomamos el higher low y la ruptura del escote podemos determinar la entrada por podemos deducir que cambiaría de tendencia buen momento para comprar.
For the purchase of the assets it is recommended that it be in a downtrend, the price should be at a higher minimum after several series of minimums, as we can identify in the downtrend graphs, the neckline that we mark with the Higher Low and its break can help us with the decision to enter, if we take the higher low and the break of the neckline we can determine the entry by we can deduce that it would change the trend, good time to buy.
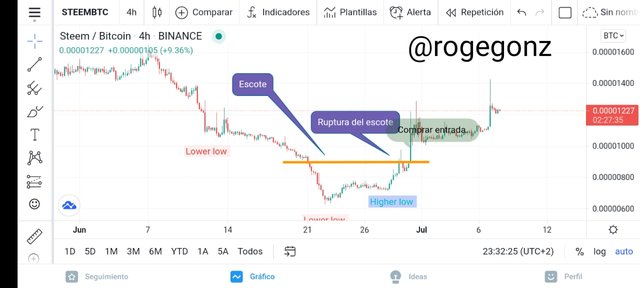
La ruptura del escote es muy importante al momento de tomar la decisión de comprar, por mi parte yo trabajo con gráficas de 15 minutos y siempre evaluó las de 5 minutos y 1 minuto para tomar una mejor decisión. Aunque el ejemplo está en un tiempo de 4 hora, que también estudio por el volumen para tener una gran entrada.
The cleavage break is very important when making the decision to buy, for my part I work with 15-minute charts and always evaluated the 5-minute and 1-minute charts to make a better decision. Although the example is in a 4 hour time, I also study for volume to have a great input.
Vender criterios de entrada
Para la vender de los activos se recomienda que esté en un tendencia alcista, el precio debería estar en un máximo más bajo luego de varias series de maximos, como podemos identificar en las gráficas de tendencias alcista, el escote que marcamos con el Lower High y su ruptura nos podrá ayudar con la decisión de vender, si tomamos el Lower High y la ruptura del escote podemos determinar la venta por podemos deducir que cambiaría de tendencia es decir que es un momento para vender.
For the sale of the assets it is recommended that it be in an uptrend, the price should be at a lower maximum after several series of highs, as we can identify in the uptrend charts, the neckline that we mark with the Lower High and its break can help us with the decision to sell, if we take the Lower High and the break of the neckline we can determine the sale by we can deduce that it would change trend that is to say that it is a time to sell.
Cuando tenemos un activó en nuestro poder y quedaremos sacarle el máximo de ganancias debemos entender el buen momento de vender para poder comprar en un precio más bajo luego, si la estructura de mercado la comprendemos bien y identificamos una temprana reversión de tendencias podemos identificar un momento bueno para la entrada de venta.
Así como son importantes los criterios de entras también lo son los de salidas ya que debemos tener en cuenta el momento de retirarnos, bien sea cuando estamos obteniendo ganancias o bien sea cuando tengamos perdidas por eso debemos tener claro los criterios de salida del mercado.
Los criterios de salida se dividen en 2, uno cuando se va generando ganancias y otro cuando estamos generando perdidas, voy a explicar cada uno de ellos.
When we have an asset in our possession and we want to get the maximum profit from it, we must understand the good time to sell to be able to buy at a lower price later, if we understand the market structure well and identify an early trend reversal, we can identify a moment good for sales entry.
Just as the entry criteria are important, so are the exit criteria since we must take into account the moment to withdraw, either when we are making profits or when we have losses, so we must be clear about the criteria for exiting the market.
The exit criteria are divided into 2, one when it is generating profits and another when we are generating losses, I will explain each of them.
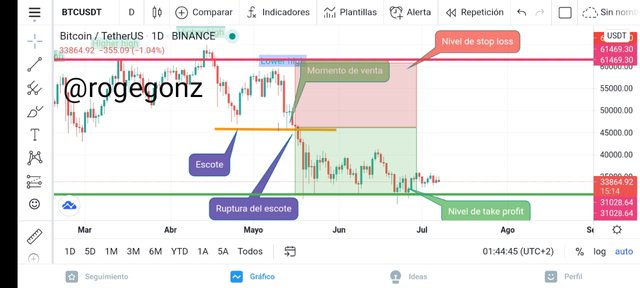
Criterios de salida en caso de Perdidas
Debemos marcar un stop loss para proteger nuestras inversiones, es un límite de perdida que asumimos en caso de que las operaciones no se den como queremos, de esa manera estamos un poco más tranquilo al momento de operar, también es importante no caer en fomo y tener paciencia.
El stop loss debe estar comprendido un poco por encima del máximo más bajo en el caso de las ventas, y un poco por debajo del mínimo más alto en el caso de las compras.
El precio pasa los niveles del stop loss es un buen criterio de salida y podemos ponerle fin a nuestra operación y esperar otro momento en el mercado.
We must mark a stop loss to protect our investments, it is a loss limit that we assume in case the operations do not go as we want, that way we are a little calmer when operating, it is also important not to fall into fomo and have patience.
The stop loss should be slightly above the lowest high for selling, and slightly below the highest low for buying.
The price passes the stop loss levels is a good exit criterion and we can put an end to our operation and wait for another moment in the market
Criterios de salida en caso de Ganancias
Los primeros que debemos tener claros es cuánto es el porcentaje del beneficio que queremos para eso podemos establecer el nivel Take Profit es muy importante tener presente eso. En la económica mientras más tomas el riesgo de invertir más ganancias se obtendrá. Por ende se recomienda trabajar de la siguiente manera 1:1 RR (riesgo recompensa) cuando el precio llega a los niveles que deseamos podemos recoger nuestras ganancias y seguir en el mercado.
The first thing we must be clear about is how much is the percentage of the profit that we want for that we can establish the Take Profit level, it is very important to keep that in mind. In the economy, the more you take the risk of investing, the more profits you will get. Therefore, it is recommended to work in the following way 1: 1 RR (risk reward) when the price reaches the levels we want we can collect our profits and continue in the market.
5 - Coloque 2 operaciones de demostración en criptoactivos utilizando la estrategia de ruptura de la estructura del mercado. Puede usar un período de tiempo más bajo para estas operaciones de demostración (se necesitan capturas de pantalla)
My first trade is a sell delivery of the ATA / USDT pair that I made by doing my analysis and realizing my cleavage breakout and the coming trend reversal. I made my sell entry at $ 0.48500, set my stop loss at 0.49800 and my target profit of 0.46750 from the lowest high of the previous trend.
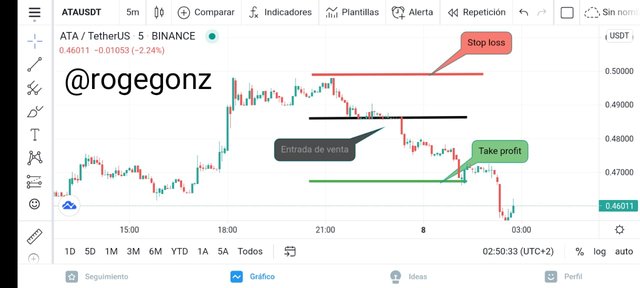
Cómo pueden ver el análisis trajo sus frutos ya que después de la ruptura del escote, el precio descendió más y pude comprar en mi take profit y como pueden observar todavía pasó ese valor y tiene más descenso.
As you can see, the analysis brought its fruits since after the break in the neckline, the price fell more and I was able to buy in my take profit and as you can see that value still passed and has more decline.
En mi segundo ejemplo quise probar mis conocimientos adquiridos así que decidí comprar, realicé mi entrada de comprar en el par de BNB/ETH en el gráfico de 3 minutos, quise hacer una compra en corto periodo.
Realicé mi entrada de comprar en 0.14545$ marque mi stop loss en 0.14500$ y mi take profit en 0.14570$ como es mi primera entrada de compra usando la estrategia de ruptura de mercado, así que no me quise exceder ni arriesgar mucho.
In my second example I wanted to test my acquired knowledge so I decided to buy, I made my entry to buy in the BNB / ETH pair on the 3-minute chart, I wanted to make a purchase in a short period.
I made my buy entry at $ 0.14545, set my stop loss at $ 0.14500 and my take profit at $ 0.14570 as it is my first buy entry using the market breakout strategy, so I did not want to exceed or risk too much.
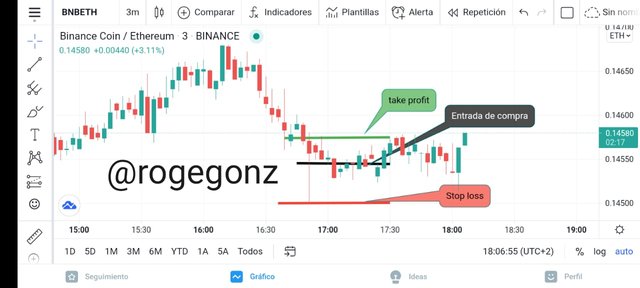
Cómo pueden ver en la gráfica si tuvo una subida y pude vender y obtener ganancias mi estudio del stop loss es bueno ya que no lo rompe y es apenas el comienzo de la tendencia.
How can you see on the chart if it had a rise and I was able to sell and make a profit? My study of the stop loss is good since it does not break it and is just the beginning of the trend.
Conclusión
Gracias por la clase @criptokraze esa fue toda mi participación.
The study of the market structure is something fantastic, I have important thanks professor for your teachings, now I have to put all that learning into practice to continue improving, I consider that to carry out professional trading we must be clear about the market structure, in the same way the possible trend breaks that exist.
Thanks for the class @criptokraze that was all my participation.
 )
)
Every day your post will be curated if you delegate some SP to @steem.education
Delegation link for @steem.education