Crypto Academy / Temporada 3 / Semana 1 - Publicación de tareas para [kouba01] .. Ichimoku kinko hyo por @rogegonz
Crypto Academy / Temporada 3 / Semana 1 - Publicación de tareas para [kouba01] .. Ichimoku kinko hyo por @rogegonz

Para mí es un placer volver a la academia de #SteemitCryptoAcademy ya es la tercera temporada y estoy muy ansioso por seguir aprendiendo, no saben todo lo que me ayudaron con las otras temporadas, gracias a eso puedo hacer trading, Golding y tener varios cripto activos, ahora toca seguir aprendiendo y mejorando. He tenido la oportunidad de poder realizar varias tareas que me han ayudado muchísimo. Ahora vengo renovado para esta tercera temporada y quiero aprender mucho más. Me parece muy interesante este método de "Ichimoku kinko hyo" y demuestra el crecimiento que vamos teniendo poco a poco, soy @rogegonz y a continuación presentaré mi trabajo!
For me it is a pleasure to return to the #SteemitCryptoAcademy it is already the third season and I am very eager to continue learning, they do not know everything that helped me with the other seasons, thanks to that I can trade, Golding and have several crypto assets Now it's time to keep learning and improving. I have had the opportunity to perform various tasks that have helped me a lot. Now I am renewed for this third season and I want to learn much more. I find this method of "Ichimoku kinko hyo" very interesting and it shows the growth that we are having little by little, I am @rogegonz and then I will present my work!

¿Qué es el indicador Ichimoku Kinko Hyo? ¿Cuáles son las diferentes líneas que lo componen? (se requieren capturas de pantalla)
El nombre del indicador en su idioma natal el japonés sería "El gráfico de balance de un vistazo" para mí tiene mucho sentido ya que si comprendemos bien el indicador podemos hacer un buen análisis de un vistazo.
Así como otros indicadores como pueden ser el del "hombre compuesto de elliot" que están basado de el comportamiento humano, Goichi Hosoda notó que los humanos y grupos de personas en su vida normal a veces actúan de alguna manera anormal o no como siempre actúan, pero pronto vuelven a la situación normal, que es el estado de equilibrio. De esa manera realiza sus análisis y le dió razonamiento a su indicador, estudiando la conducta humana que para Goichi gira dentro de un círculo alejándose del punto de equilibrio pero volviendo al mismo.
El indicador Ichimoku Kinko Hyo está compuesto por 5 líneas las cuales se pueden agrupar en grupos de tres, a continuación mostraré un gráfico dónde se pueden observar las diferentes lineas detalladamente.
Las 5 líneas son llamas:
*Tenkan-sen Línea de conversión o línea rápida
*Kijun-sen Línea de base o línea lenta
*Senkou Span A. Tramo principal A
*Senkou Span B Tramo principal B
*Chikou Span. Intervalo de retraso
Taking up what teacher @ kouba01 taught us in class, the Ichimoku Kinko Hyo indicator is a versatile technical indicator that was built by Japanese journalist Goichi Hosoda in the 1960s. This journalist began working on the development of the indicator before the Second World War, more however the indicate was not widely used since it did not have a translation into English therefore many countries did not know of its existence.
The name of the indicator in its native language of Japanese would be "Balance chart at a glance" to me makes a lot of sense since if we understand the indicator well we can do a good analysis at a glance.
As well as other indicators such as the "man composed of elliot" that are based on human behavior, Goichi Hosoda noted that humans and groups of people in their normal lives sometimes act in some abnormal way or not as they always do, but soon they return to the normal situation, which is the state of equilibrium. In this way, he carried out his analyzes and gave reasoning to his indicator, studying human behavior that for Goichi rotates within a circle, moving away from the equilibrium point but returning to it.
The Ichimoku Kinko Hyo indicator is composed of 5 lines which can be grouped into groups of three, below I will show a graph where the different lines can be observed in detail.
The 5 lines are flames:
- Tenkan-sen Conversion line or fast line
- Kijun-sen Baseline or slow line
- Senkou Span A. Main section A
- Senkou Span B Main section B
- Chikou Span. Delay interval
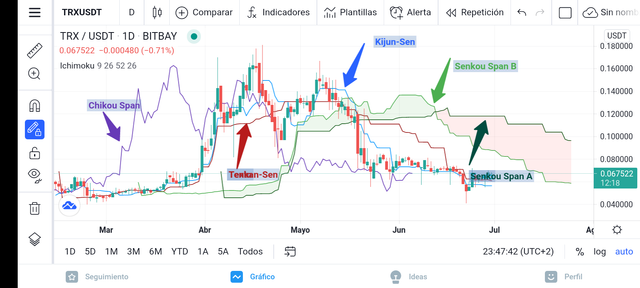
En el gráfico podemos observar las 5 líneas que componen el indicador del Ichimoku Kinko Hyo cada una con su nombre.
Ahora les explicaré la manera de trabajar de los 3 grupos que se forman con las 5 líneas
• El Tenkan-Sen y el Kijun-Sen: Son líneas que corresponden al nivel medio de los mínimos y máximos de un precio del activó en el periodo en el cual se calcula. Sus fórmula es (Mayor + Menor)/2. Con ellas podemos Saber cuándo puede haber un cambio de tendencia alcista o bajista y detectar las resistencias o soportes.
• El Senkou Span A y el Senkou Span B: Estas líneas que proyectan hacia el futuro, trabajan a la par pero sin embargo su calculo es diferente.
El área que marcan está 2 lineas en el gráfico se denomina como la nube de Ichimoku y está representada en colores en el gráfico, si es alcista su color es verde, si es bajista si color es rojo.
Senkou Span A conocido como SSA
Senkou Span B conocido como SSB
• El Chikou Span: es conocida también como Lagging Span y representa el valor del activó pero 26 períodos antes
In the chart we can see the 5 lines that make up the Ichimoku Kinko Hyo indicator, each with its name.
Now I will explain to you the way of working of the 3 groups that are formed with the 5 lines
• The Tenkan-Sen and the Kijun-Sen: These are lines that correspond to the average level of the minimums and maximums of a given period. Its formula is (Major + Minor) / 2. With them we can know when there may be a change in the upward or downward trend and detect resistance or supports.
• Senkou Span A and Senkou Span B: These lines that project into the future, work in tandem but nevertheless their calculation is different.
The area marked by 2 lines on the chart is called the Ichimoku cloud and is represented in colors on the chart, if it is bullish it is green, if it is bearish if it is red.
Senkou Span A known as SSA
Senkou Span B known as SSB
• The Chikou Span: it is also known as Lagging Span and represents the value of the asset but 26 periods before
¿Cómo agregar el indicador Ichimoku al gráfico? ¿Cuáles son sus configuraciones predeterminadas? ¿Y debería cambiarse o no? (Se requieren capturas de pantalla)
To argue my answer I clarify that the screenshots that I will show below, are taken from my Moto G8 power Lite phone and using the mobile phone application of: Trading-view
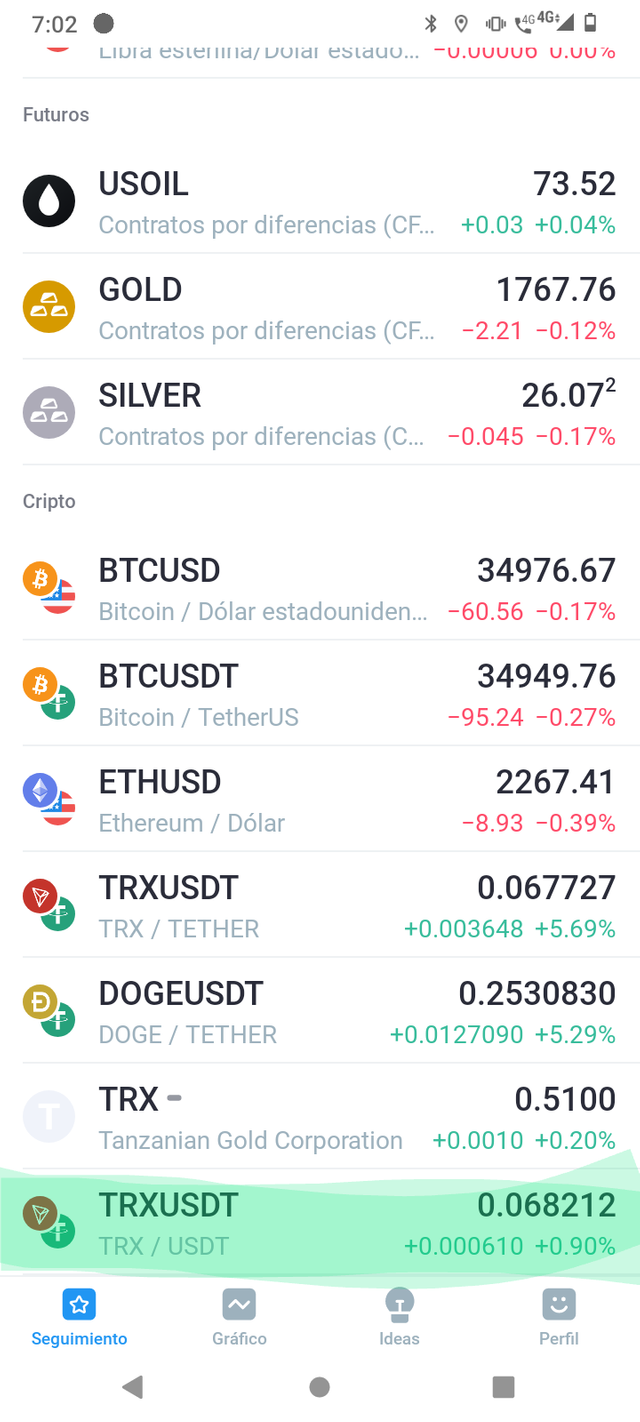
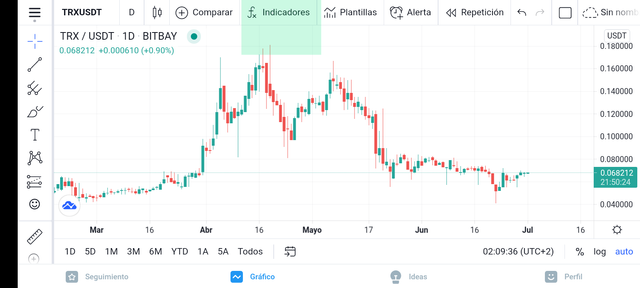
Al entrar a la aplicación busco el par con el cual aplicaré el método en este caso es el de: TRX/USDT
When entering the application I look for the pair with which I will apply the method in this case it is: TRX / USDT
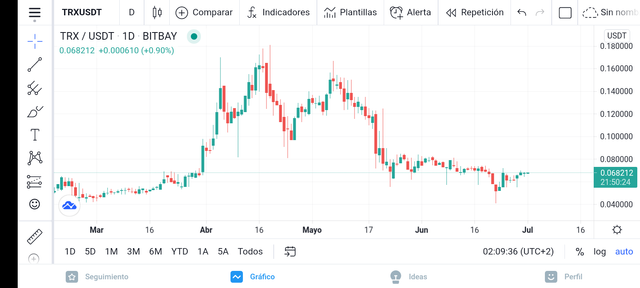
Al pisar en el par nos aparecerá los valores del precio, volumenes, velas, todo como en cualquier exchange
When stepping on the pair we will see the values of the price, volumes, candles, everything as in any exchange
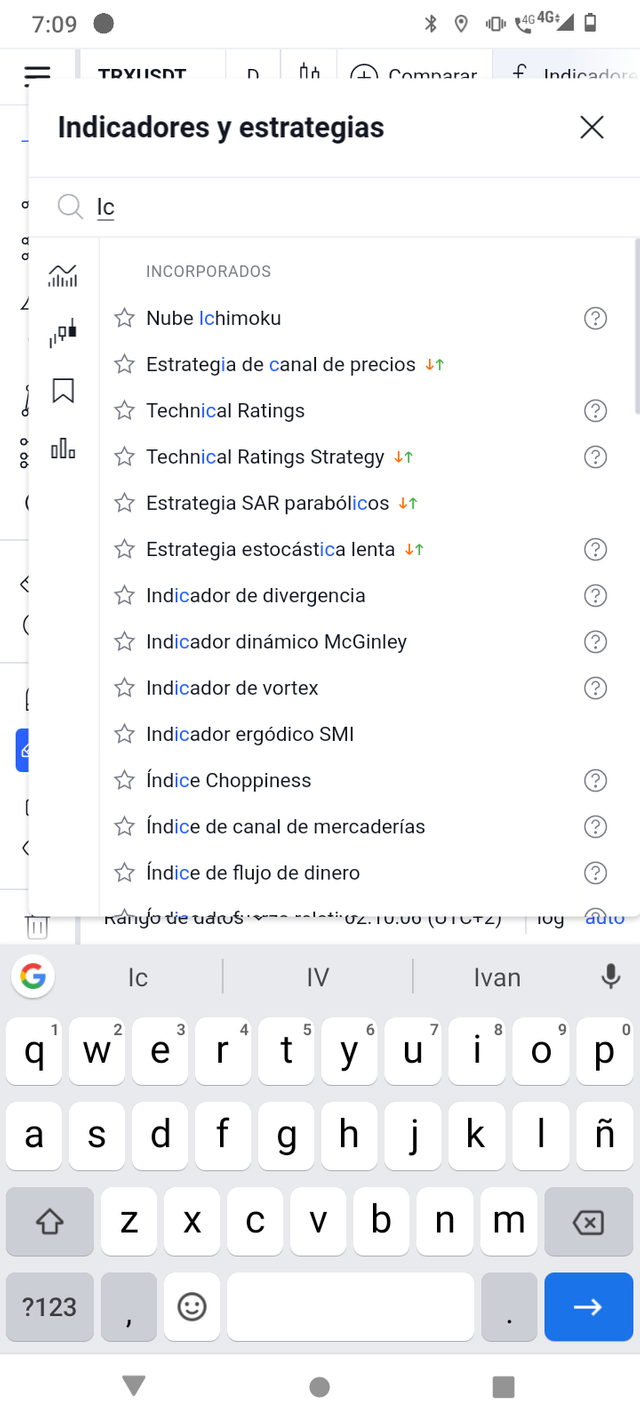
Allí en la aplicación nos muestra la opción de los indicadores que deseamos aplicación, entonces pasaremos allí y buscaremos el indicador de "Nube de Ichimoku"
There in the application it shows us the option of the indicators that we want to apply, then we will go there and look for the indicator of "Ichimoku Cloud"
Al seguir estos pasas ya la aplicación nos muestra el indicador en el gráfico que queremos.
By following these passes, the application shows us the indicator on the chart that we want.
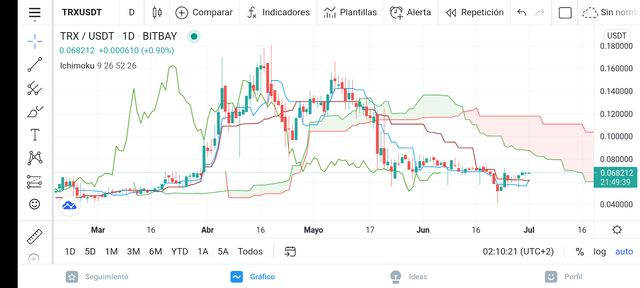
Cómo pueden ver en la imagen ya tenemos el indicador en nuestra gráfica, ya por defecto predeterminado el indicador viene con los siguientes valores
As you can see in the image we already have the indicator in our graph, by default the indicator comes with the following values
Que corresponden al desplazamiento de cada línea en que corresponden a su rango en el gráfico, podemos ver las nubes que se forman, tanto de tendencias alcista como bajista, podemos observar los 26 periodos anteriores de la línea de Chikou Span, también los 52 periodos que representan 2 meses de trabajo en el antiguo Japón, así como los 9 días de las semana y media ( 6 una semana + 3 media semana ) y así sucesivamente cada uno de los valores que componen el indicador de Ichimoku.
*Tenkan-sen. 9
*Kijun-sen. 26
*Senkou span A 26
*Senkou span B 52
*Chikou Span. 26
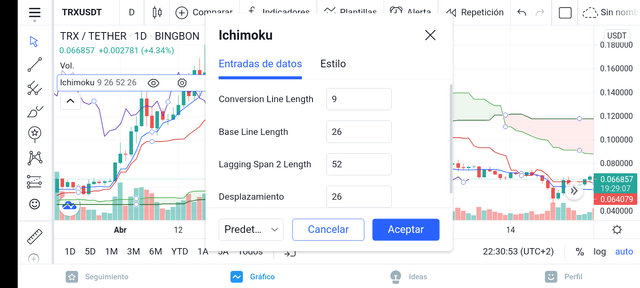
Los valores vienen predeterminados ya, se puede. Cambiar para evaluar y comprender las líneas que deseamos estudiar detalladamente, como lo haremos en las siguientes preguntas.
That correspond to the displacement of each line in which they correspond to its range on the graph, we can see the clouds that are formed, both with upward and downward trends, we can observe the 26 previous periods of the Chikou Span line, also the 52 periods that each of the values that make up the Ichimoku indicator represent 2 months of work in ancient Japan, as well as 9 days a week and a half (6 a week + 3 a half week) and so on.
- Tenkan-sen. 9
- Kijun-sen. 26
- Senkou span A 26
- Senkou span B 52
- Chikou Span. 26
The values are already predetermined, you can. Change to evaluate and understand the lines that we want to study in detail, as we will do in the following questions.
¿Cómo utilizar la línea Tenkan Sen? ¿Cómo usar la línea Kijun Sen? ¿Y cómo usarlos simultáneamente? (Se requieren capturas de pantalla)
La línea "Tenkan sen" corresponde a la mediana de su máximo y mínimo del período sobre el que se calcula, en su caso representa la mediana de 9 días máximo y mínimo, su función individual de "Tenkan sen" es principalmente para detectar señales de mercado y tendencias a corto plazo.
Si la linea de "Tenkan Sen" está subiendo quiere decir que el mercado tiene una tendencia alcista por otra parte si la línea va hacia abajo, significa que el mercado está en tendencia bajista y si la línea va horizontal, indica un movimiento de mercado de rango o lateralidad.
Es muy importante para ayudarnos determinar las tendencias de esa manera podemos tomar una mejor decisión si queremos vender o comprar en terminado periodo.
The line "Tenkan sen" corresponds to the median of its maximum and minimum of the period over which it is calculated, in its case it represents the median of 9 days maximum and minimum, its individual function of "Tenkan sen" is mainly to detect signs of market and short-term trends.
If the "Tenkan Sen" line is going up, it means that the market is trending upwards, on the other hand, if the line is going down, it means that the market is in a downward trend and if the line is horizontal, it indicates a market movement of range or laterality.
It is very important to help us determine trends so that we can make a better decision if we want to sell or buy in a certain period.
La línea de "Kijun sen" corresponde a la mediana de su máximo y mínimo del precio del activó en un período sobre el que se calcula, en su caso representa la mediana de 26 días máximo y mínimo por lo tanto es más lenta, señala individualmente el movimiento del precio en medio plazo, el soporte y la resistencia.
Ahora analizaré los cruces de ambas líneas y su representación.
The line of "Kijun sen" corresponds to the median of its maximum and minimum of the period on which it is calculated, in its case it represents the median of 26 days maximum and minimum, it indicates individually the movement of the price in the medium term, the support and the resistance.
Now I will analyze the crossings of both lines and their representation.
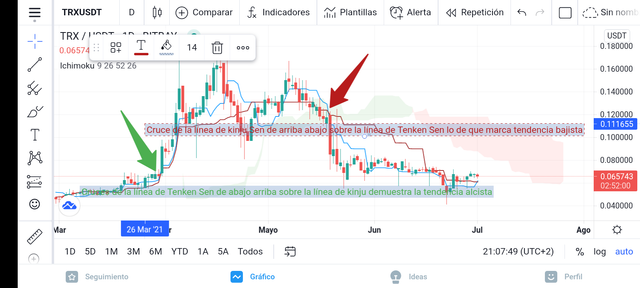
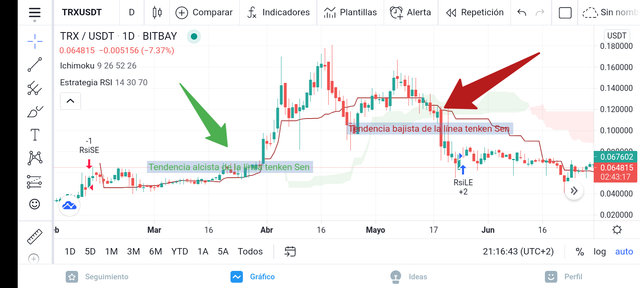
Cuando la línea de Tenken cruza la línea kijun de abajo hacia arriba, se conoce como cruce alcista e indica la próxima tendencia alcista como pueden ver en la imagen, Por otra parte, cuando la línea de kijun cruza le tenken de arriba hacia abajo, se conoce como cruce bajista e indica la tendencia bajista en la imagen podemos observar los cruces mencionados y ver las tendencias.
When the Tenken line crosses the kijun line from the bottom up, it is known as an upward crossing and indicates the next uptrend as you can see in the image.On the other hand, when the kijun line crosses the tenken from the top down, it is known as a bearish crossover and indicates the downtrend in the image we can observe the aforementioned crosses and see the trends.
¿Qué es la línea chikou span? ¿Y cómo usarlo? ¿Y por qué a menudo se descuida? (se requieren capturas de pantalla)
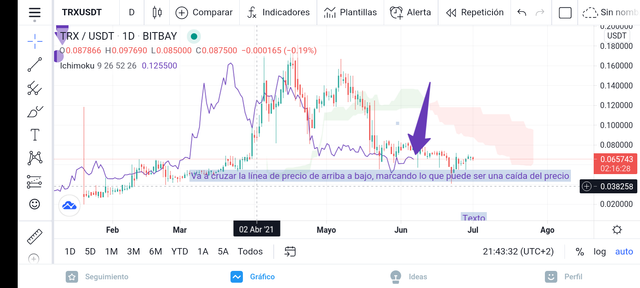
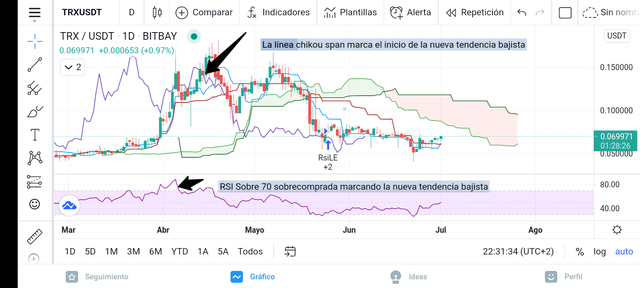
La línea chikou span es la línea que representa los 26 periodos antes del periodo actual, y funciona para determinar si el precio aumenta o disminuye ya que su movimiento es igual al de el precio solo que 26 periodos antes. Entonces permite detectar si el valor del activó aumenta o disminuye dependiendo como viene trazando la linea en comparación a la línea de precio en el periodo actual.
The chikou span line is the line that represents the 26 periods before the current period, and it works to determine if the price increases or decreases since its movement is equal to that of the price only 26 periods before. Then it allows to detect if the value of the asset increases or decreases depending on how it has been drawing the line compared to the price line in the current period.
A menudo es descuidada por los comerciantes ya que ellos consideran que no tiene ninguna relevancia y que no da señales importante a la hora de tomar una decisión si comprar o vender.
It is often neglected by traders as they consider that it is irrelevant and that it does not give important signals when making a decision whether to buy or sell.
¿Cuál es el mejor período de tiempo para usar Ichimoku? ¿Y cuál es el mejor indicador para usar con él? (se requieren capturas de pantalla)
El mejor pedido de tiempo para usar el indicador de Ichimoku varía dependiendo la utilidad que le da el comerciantes y que señal quiere tomar del indicador, yo trabajo a base del Golding y utilizaría el indicador en el periodo de distribución y trabajaría en funsion a la tendencia que me puede predecir el indicador y la nube que me marcaría, a si vez utilizaría múltiples marcos de tiempo para diversas perspectivas de negociación así sabré que decisión es la correcta.
El indicador Ichimoku trabajaría perfecto con el indicador RSI sabemos que el indicador RSI nos marca si estamos en sobrevendidos (menos de 30) o sobrecomprado (mayor a 70) entonces cuando se combina con ichimoku, la predicción de inversión de tendencia en la nube puede ser más precisa y perfecta por lo tanto sería el mejor indicador para trabajar con Ichimoku.
The best time order to use the Ichimoku indicator varies depending on the utility that the trader gives him and what signal he wants to take from the indicator, I work based on the Golding and I would use the indicator in the distribution period and would work according to the trend that I can predict the indicator and the cloud that would mark me, at the same time I would use multiple time frames for different trading perspectives so I will know which decision is the correct one.
The Ichimoku indicator would work perfect with the RSI indicator, we know that the RSI indicator marks us if we are oversold (less than 30) or overbought (greater than 70) so when combined with ichimoku, the trend reversal prediction in the cloud can be more precise and perfect therefore it would be the best indicator to work with Ichimoku.
Conclusión
The Ichimoko cloud is a complete indicator with many lines that provides various signals ranging from support, resistance, downtrend, uptrend, current trend and seeks at a glance to predict the behavior of the markup, as its name says in Japanese language, helps us make a purchase or sale decision depending on the trend. It is a very complete indicator that if we combine it with another indicator such as RSI, they would provide us with a super safe reliability.
CC:
@kouba01

Dear @rogegonz
Thank you for participating in Steemit Crypto Academy Season 03 and making efforts to complete the homework task. You got 6.5/10 Grade Points according to the following Scale;
Key Notes:
We appreciate your efforts in Crypto Academy and look forward to your next homework tasks.
Regards
@cryptokraze
Gracias profesor @cryptokraze trataré de mejorar!