Trading Using Wedge Pattern - Crypto Academy / S5W5 - Homework Post for @sachin08
Hello steemian ...
This is my new post in the Steemit Crypto Academy community, on this season 5 week 5, I will be working on a homework from professor @sachin08 with the theme "Trading Using Wedge Pattern”.

we will discuss it through the homework below:

1.) Explain Wedge Pattern in your own word.
Wedge pattern is one of the patterns used in conducting technical analysis to be able to see trend continuation or trend reversal. This wedge pattern is shaped like a conical triangle or a saw in the real world. Just like the triangle pattern, this wedge pattern uses two trendlines, the upper line is usually referred to as resistance and the bottom line is usually referred to as support, this wedge pattern ends when the price chart breaks a support or resistance level.
The wedge pattern can show three trends in a bullish or bearish state, but we can't conclude quickly if we use this wedge pattern. This happens because the wedge pattern can give a signal that the trend will continue or the trend will reverse. For example, if the wedge pattern is formed when the trend is bullish, we cannot conclude that the trend will reverse or the trend will continue, we can conclude that the trend will continue or reverse if the price chart has broken the support or resistance level.
The wedge pattern has two types of patterns, both types of patterns depending on the pattern are formed in a bullish or bearish trend. If the wedge pattern is formed in a bullish trend, which means the wedge pattern forms a saw moving upwards, it is called a “Rising Wedge”, if the wedge pattern is formed when the trend is bearish, which means the wedge pattern is pointing downwards, it is called a “Falling Wedge”. An example of the two wedge patterns can be seen in the image below.


2.) Explain both types of Wedges and How to identify them in detail. (Screenshots required)
Two types of wedges patterns can be used, the two types of wedges patterns are Rising Wedge and Falling Wedge. I will explain the two types of wedges patterns below.
- Rising Wedge
This rising wedge pattern has the shape of a wedge pattern that points upwards or a saw-shaped pattern that points upwards. This rising wedge pattern has the form of a support level that is steeper than the resistance level or the low price chart (low) rises faster than the high price (high) which makes the price chart shaped like a saw.
Although the rising wedge pattern has an uphill shape, we can see that the momentum of the rising trend in the form of the rising wedge pattern is getting weaker, which means the trading volume is getting thinner.
Previously I have discussed that this wedge pattern allows us to know the trend will continue or vice versa. On rising wedge, if the pattern is formed when the trend is bullish, then the trend will likely reverse, if the pattern is formed when the trend is bearish, the trend will most likely continue.
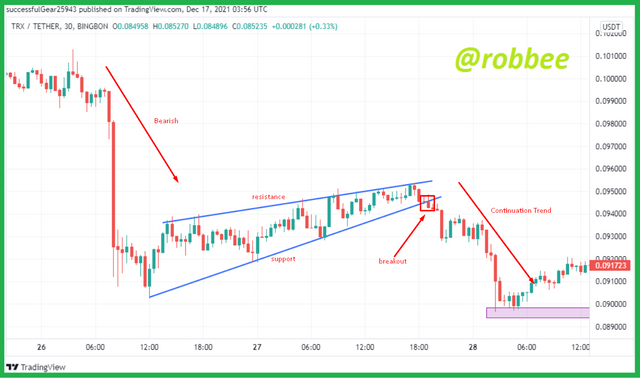
As in the picture above, we can see that rising wedge are formed when the trend is bearish, then the price chart breaks the support level on the rising wedge, which means the trend will continue to be bearish.
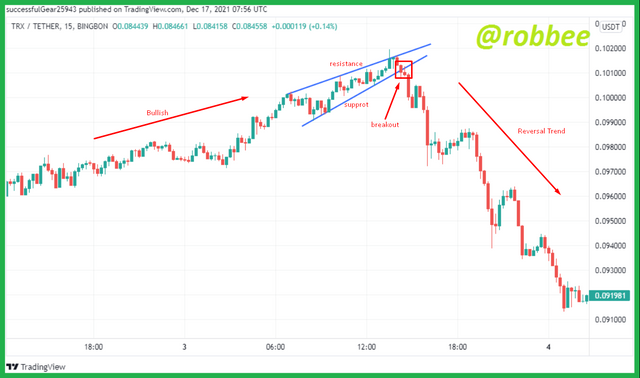
In the example above, rising wedge are formed when the trend is bullish, which means there will be a reversal in the direction of the trend, and we can see for ourselves that the price chart broke the support level on the rising wedge.
From the two examples above, we can conclude that when these rising wedge are formed, the price chart will experience a downtrend. Here we already know about the rising wedge pattern, we also have to know how to identify this rising wedge pattern so that we can use it when trading because rising wedge are not an easy pattern to use, therefore we have to get used to using it.
To identify rising wedge in the market, at first we look at the price chart that is pointing upwards but with the price chart getting smaller. After encountering the chart, we create support and resistance limits, provided that the support level is steeper than the resistance level. We also have to look at the touch of the candle at the support and resistance levels, for rising wedge at least give 5 touches to the support and resistance limits. After some of the conditions above are listed on the market price chart, rising wedge are formed and we just have to wait for a breakout to occur. like in the example below.

In the picture above, we can see that there is a price chart that is pointing upwards with the price chart getting smaller. Next, I draw the support and resistance limits, when I draw the support and resistance limits, the support level is steeper than the resistance level, after the support and resistance levels are formed, we can see that there are 5 chart touches at the support and resistance levels, which means a rising wedge pattern is formed. . Then a breakout occurs at the support level which signals a signal for sell entry.
- Falling Wedge
Falling wedge are the opposite of rising wedge in the explanation above. Falling wedge have the shape of a wedge pattern that points downwards or a saw-shaped pattern that points downwards. This falling wedge pattern has the form of a resistance level that is steeper than the support level or the high price chart (high) falls faster than the low price which makes the price chart shaped like a saw.
Even though the falling wedge pattern has a descending shape, we can see that the downward momentum of the trend in the form of the falling wedge pattern is getting weaker, which means the trading volume is getting thinner.
Previously I have discussed that this wedge pattern allows us to know the trend will continue or vice versa. In falling wedge, if the pattern is formed when the trend is bullish, then the trend is likely to continue, if the pattern is formed when the trend is bearish, most likely the trend will reverse up.
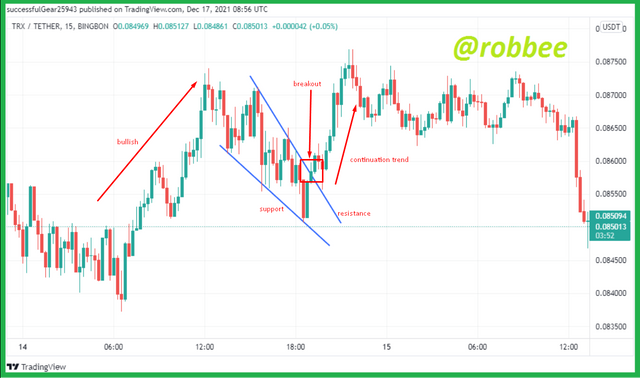
In the picture above we can see that falling wedge occur when the price chart is bullish, then the price chart breaks the resistance level, which means the price chart goes up again.
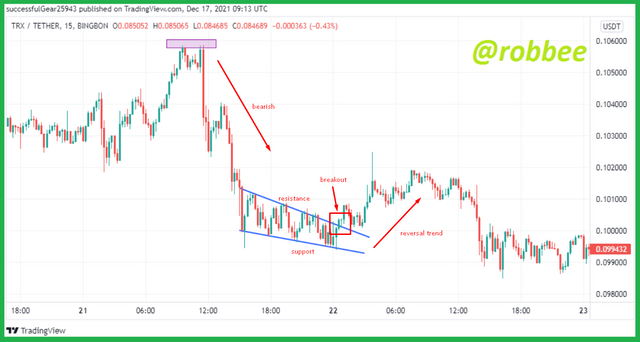
In the picture above, we can see that falling wedge are formed when the chart is bearish, then the price chart breaks the resistance level, which means the trend will reverse.
From the two examples above, we can conclude that when these falling wedge are formed, the price chart will experience an uptrend. Here we already know about the falling wedge pattern, we also have to know how to identify this falling wedge pattern so that we can use it when trading because falling wedge are not an easy pattern to use just like rising wedge, therefore we have to get used to it. use it.
To identify falling wedge, just as we identify rising wedge, at first we look at the price chart that is pointing downwards but with the price chart getting smaller. After encountering the chart, we create support and resistance limits, provided that the resistance level is steeper than the support level. We also have to look at the touch of the candle at the support and resistance levels, for falling wedge at least give 5 touches to the support and resistance limits. After some of the above conditions exist on the market price chart, falling wedge are formed and we just have to wait for a breakout to occur. like in the example below.

In the picture above, we can see that there is a price chart that is pointing downwards with the price chart getting smaller. Next, I draw the support and resistance limits, when I draw the support and resistance limits, the resistance level is steeper than the support level, then it can be seen in the picture that in the saw pattern above there are 5 touches on resistance and support, which means a falling wedge pattern is formed. Then a breakout occurs at the resistance level which signals a signal for a buy entry.

3.) Do the breakout of these Wedge Patterns produce False Signals sometimes? If yes, then Explain how to filter out these False signals.
Every time you carry out technical analysis in trading, you cannot guarantee a 100% profit or assume that the signal given when performing technical analysis is the correct signal because there have been many cases when technical analysis has given false signals. Likewise, by conducting technical analysis with the wedge pattern, we cannot guarantee that the signal given by the wedge pattern is the correct signal. Therefore we need additional technical analysis to make the signal given by the wedge pattern the correct signal, we can add indicators when doing the wedge pattern analysis so that the signal given by the wedge pattern becomes the correct signal. Many indicators can be used to strengthen the signal given by the wedge pattern, one of which is the Relative Strength Index (RSI) indicator.
The RSI indicator is one of the most widely used indicators by traders in strengthening the correct signal when conducting technical analysis. This RSI indicator tells us when the market is oversold and overbought. On the RSI indicator, there are 3 zones, the zone below the value of 30 is the oversold zone, if the chart enters the zone below 30 or oversold it indicates we can do a buy entry, the second zone is between the values of 30 to 70, this zone is the neutral zone, and the last zone is the zone above 70 which means the overbought zone, in this overbought zone it gives us a signal to enter buy.
If the signal given by the wedge pattern is the same as the signal given by the RSI indicator, it means that the signal is correct. If the signal given by the wedge pattern is different from the signal given by the RSI signal, it is a false signal. An example can be seen in the image below.
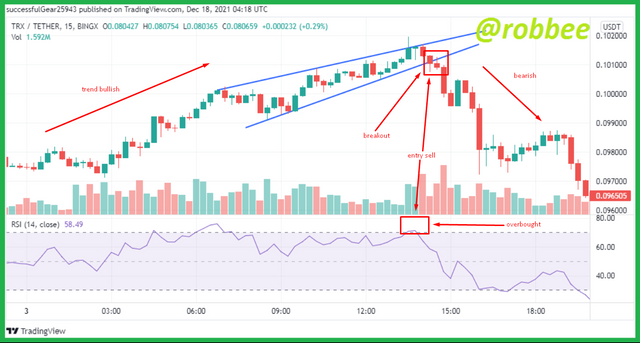
In the picture above, we can see that the trend is bullish, then rising wedge are formed. We repeat once again if rising wedge are formed when the trend is bullish, which indicates a trend reversal will occur, which means the trend will reverse to bearish. When rising wedge are formed as in the picture above, then the price chart breaks out at the support level which means a signal for a sell entry. Then tips on doing technical analysis using the RSI indicator, the RSI indicator in the picture above enters the overbought zone which means a sell entry signal. Both technical analyzes give the same sell entry signal, meaning that the signal is correct.
The picture above is an example of a true signal, I will also give an example of a false signal when using the wedge pattern.
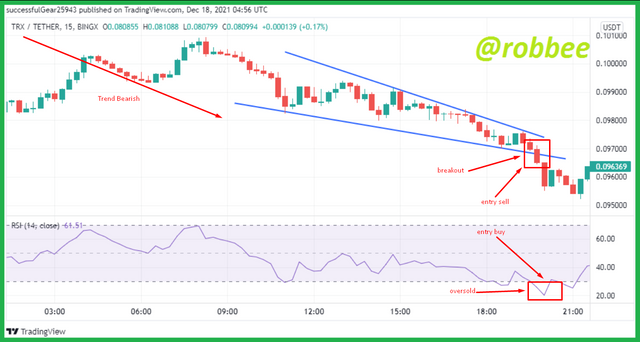
In the picture above Falling wedge are formed when the trend is bearish. Then the price chart breaks out at the support level which means a sell entry signal. then we look at the RSI indicator, the chart RSI indicator is below the value of 30 which means a buy entry. Since the two technical analyses give different signals, then the signal is giving a false signal and we should get out of the market.
In addition to the two methods above, we can use the false signal given by the RSI indicator to become an advantage. This method is used differently from the two examples above wherein the two examples above we see the results given by the RSI are the same as the wedge pattern. As for this second example, we focus on the direction of the false signal given by the RSI to the direction of the trend, for more details see the example below.
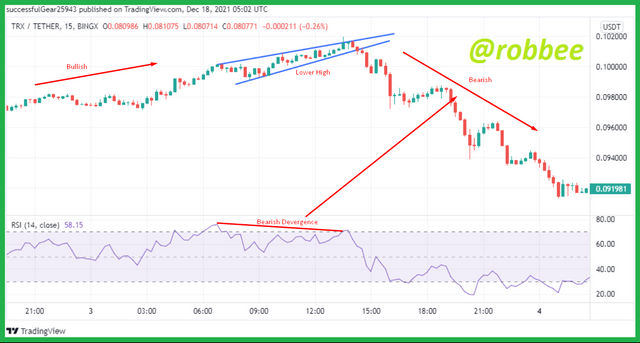
As in the picture below, we can see rising wedge are formed, which means the direction of the wedge is upward, while on the RSI indicator it is the opposite of the wedge pattern above, when rising wedge are formed on the chart the RSI indicator is pointing downwards, which means the trend direction in both analyzes is not in sync. We can take advantage of the above false signals. if in the wedge pattern that is formed is rising wedge and the RSI indicator is the opposite of the rising wedge, namely bearish, then the next trend that will be formed is bearish, which means that the next trend will be formed following the RSI indicator.

4.) Show full trade setup using this pattern for both types of Wedges.( Entry Point, Take Profit, Stop Loss, Breakout)
In addition to seeing the direction of the next trend and knowing sell or buy entries when using the wedges pattern, we also have to know where to place take profits and stop losses when using the wedges pattern.
- Rising Wedge
For entry, placing take profit and stop loss if rising wedge form on the price chart can be seen in the image below.

When Rising Wedge are formed in the market, then we have to wait for the price chart to breakout at support or resistance. In the picture above the price chart has a breakout at the support level which means a sell entry. We can make a sell entry at the close of the candle that has a breakout or the next candle after the breakout candle. in the picture above I made a sell entry on the next candle after the candle broke out, I made a sell entry at the price of $0.094238. Next, we put the take profit and stop loss. For taking profit we place it under the sell entry, we can put take profit along X as in the picture above, therefore I put take profit at the price of $ 0.091390. Then, to place the stop loss above the sell entry, we can place the sell entry until it touches the resistance level as shown above. I placed a sell entry at $0.095464.
- Falling Wedge
For entry, placing take profit and stop loss if falling wedge form on the price chart can be seen in the image below.
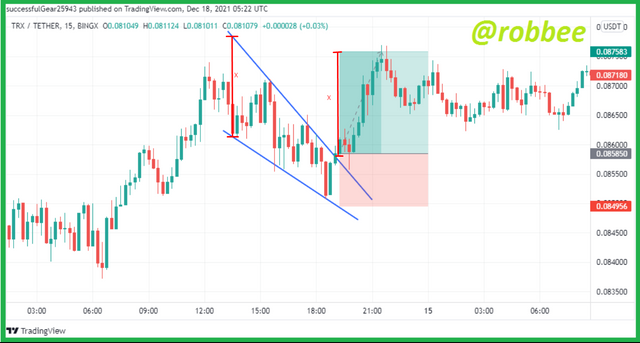
When falling wedge form in the market, just as in rising wedge, we have to wait until the price chart breaks a support or resistance level. in the picture above we can see that the price chart broke the resistance level which means we can take buy entry action. Entry buys can be taken at the close of the breakout candle or the next candle after the breakout candle. in the picture above I made a buy entry on the next candle after the candle broke out at the resistance level, I made a buy entry at the price of $ 0.08585. Then I put the take profit entry above the buy entry, put the take profit as long as X like in the picture above, then I put the take profit at the price of $ 0.087583. Then I put the stop loss under the buy entry, for placement it can be done from the buy entry until it touches the support level, in the picture above the stop loss is $ 0.084956.

5.) Conclusion
The wedge pattern is one of the patterns that can be used when trading to see if the trend will continue or the trend will reverse. This wedge pattern has a saw-like shape, the wedges pattern has 2 types, rising wedge, and falling wedge. Rising wedge have a saw-like shape pointing upwards while falling wedge have a saw-like shape pointing downwards. Rising wedge are usually referred to as bearish wedge because when rising wedge are formed in the market, the chart will go down if rising wedge are formed when the market is in a bullish state, it indicates a trend reversal will occur, whereas when rising wedge are formed when the trend is bearish, it indicates the trend will continue. While falling wedge are usually referred to as bullish wedge because when falling wedge are formed on the chart they are likely to be bullish, if falling wedge are formed when the market is bullish then the trend will most likely continue, while when falling wedge are formed when the trend is bearish, the trend will likely reverse. When using the wedge pattern, don't forget the false signals, we can use the help of indicators to strengthen the signals given by the wedge pattern.

References:
https://www.tradingview.com/chart/ITAaNOcQ/
https://www.google.com/amp/s/www.seputarforex.com/amp/artikel/chart-pattern-wedge-63763-31
https://howtotradeblog.com/what-is-wedge-pattern/
https://www.seputarforex.com/amp/artikel/pola-rising-wedge-dan-falling-wedge-243621-31
