Steemit Crypto Academy Week 16 by @kouba01 : Cryptocurrency Trading with Bollinger Bands
Hello steemian ...
This is my new post in the Steemit Crypto Academy community, on this 16th week I will be working on a homework from professor @kouba01 with the theme "Cryptocurrency Trading with Bollinger Bands".
SOURCE:https://howtotradeblog.com/id/3-strategi-perdagangan-indikator-bollinger-bands-terbaik/
Bollinger bands were created by John Bollinger in 1980, John Bollinger is a technician trader. Bollinger bands were created to serve as technical indicators determining the direction of market trends and measuring volatility. The characteristic of this indicator is the condition of market price movements moving between two bands (bands). Now, bollinger bands are becoming a widely used indicator in trading in various types of markets
For that I will immediately explain it according to the homework given by professor @kouba01
1. Define the Bollinger Bands indicator by explaining its calculation method, how does it work? and what is the best Bollinger Band setup?
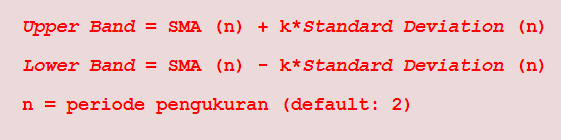
The calculation method uses the formula:
SOURCE:https://www.inbizia.com/cara-menggunakan-indikator-bollinger-bands-134139
On the Bollinger Bands indicator there is a Simple Moving Average (SMA) which is squeezed by two bands, namely the upper band and the lower band. The upper band is called the Upper Bollinger Band while the lower band is called the lower Bollinger Band.
The upper and lower bands can change following the increase or decrease in the value of the Simple Moving Average (SMA) based on how the standard deviation works, where the standard deviation measures how much volatility the price can move from the price it should have, meaning that the upper and lower bands can change. follow market conditions.
Best Bollinger Band settings
In accordance with the recommendation of John Bollinger, that the best use is the 20-day moving average. In this setting, it is recommended to use 2 standard deviations based on the 20-day moving average. This setting will later make the distance between the Upper and lower bands further apart so that it shows a very clear trend, so it will be very easy to draw to identify it.
2. What is a breakout and how do you determine it?
A breakout is a time when the stock price moves through the upper band or is outside the resistance, the advantage for users of this strategy is that if the analysis is carried out appropriately and correctly, it will get the maximum profit.
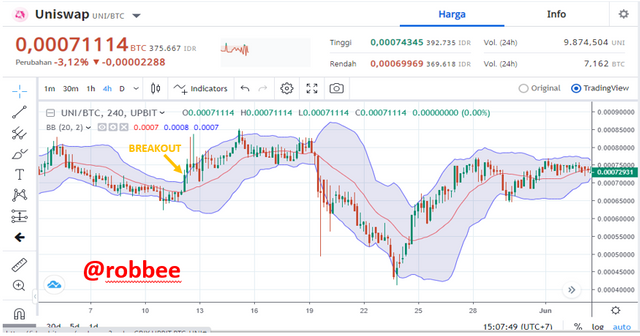
this picture from upbit and edited by me
Based on the Uniswap coin chart above, we can determine that the breakout is located on 12 may 2021 with a coin price of 0.00073283. it is known after seeing that the price at that time broke the upper band.
3. How to use Bollinger bands with a trending market?
Actually, using bollinger bands when trending is not as good as when doing it sideways. But we can still do it with 2 tips, the first is when the uptrend condition, where the price breaks the upper band and the closing price is outside the band. The second is when the condition is downtrend, which is where the price breaks through the lower band and closes outside the band. We can do a buy entry when the price or bar formation has completely exited the upper band.
This can be exemplified below:
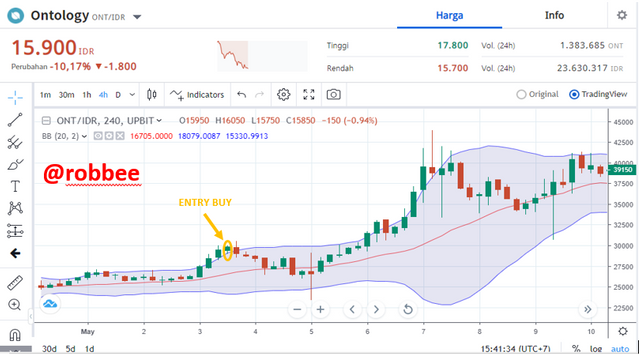
this picture from upbit and edited by me)
From the coin ontology chart, we made a purchase or entry buy on May 3, 2021 at a coin price of 30073 IDR, because at that time the bar formation was completely out of the upper band.
4. What is the best indicator to use with Bollinger Bands to make your trade more meaningful?
In my opinion, the best indicator to use with bollinger bands is the MACD indicator. Because MACD has excellent clarity in showing market conditions based on the direction of the trend and its momentum. So that we will get very clear information about when is the best time to enter and get the best information about the best time to buy and sell. I will give an example as follows:
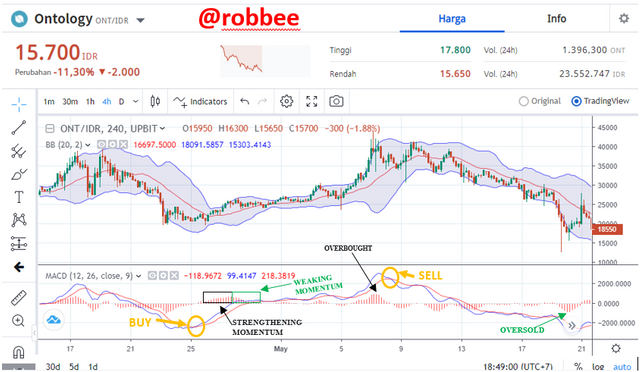
this picture from upbit and edited by me
at this stage I use the chart from the coin ontology, I use the basic MACD settings (12,26,9). As I said earlier, using MACD will show the direction of the trend based on its momentum. An example of strengthening momentum is from April 25 to 27, it can be seen from the histogram that moves from short to long. Meanwhile, the momentum weakened, namely in the middle of April 27, it can be seen from the histogram which started from long to continue to shorten. Then you can see the best time to buy, which is when the EMA-12 and EMA-26 cross each other from the bottom up. While the best time to sell is when the EMA-12 and EMA-26 cross each other from top to bottom. Even to know the state of overbought and oversold, just by looking at the top of the MACD area. For overbought, the peak of the MACD area is in the positive area, while for oversold, the peak of the MACD area is in the negative area. Using the MACD indicator with bollinger bands is really very easy to read the chart.
5. What timeframe does the Bollinger Bands work best on?And why?
actually the bollinger band indicator works very well in every time frame and of course the needs of traders will be different for each timeframe they use. For swing traders, they are more focused on observing weekly, daily and 4-hour charts while for scalping traders they are more focused on observing 1-hour charts to 15-minute charts.
But for the visualization factor, the Bollinger band indicator is easiest to observe on charts with smaller timeframes such as daily charts, 4 hours and below because it displays more detailed charts and is easier to read, while for large timeframes such as weekly and monthly, observe it. will be more difficult because it displays a chart with shorter Bollinger bands.
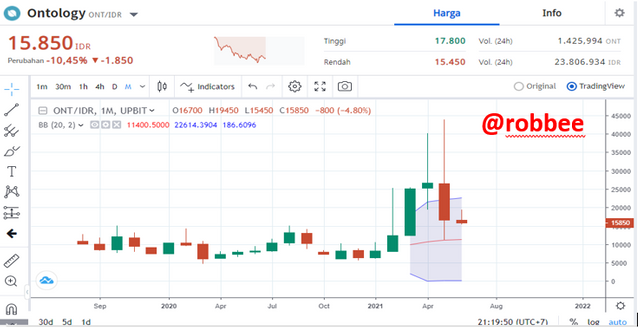
monthly timeframe
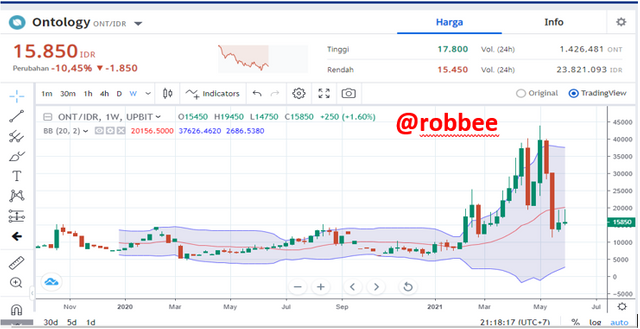
weekly timeframe
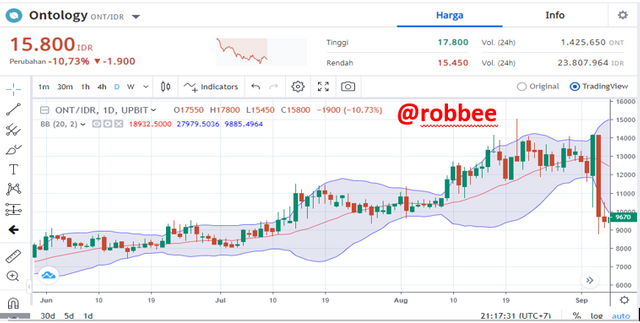
daily timeframe
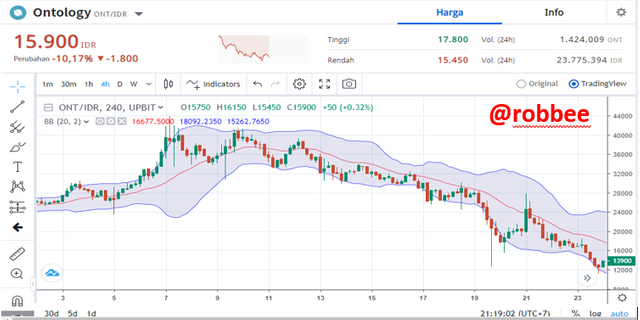
timeframe 4 hours
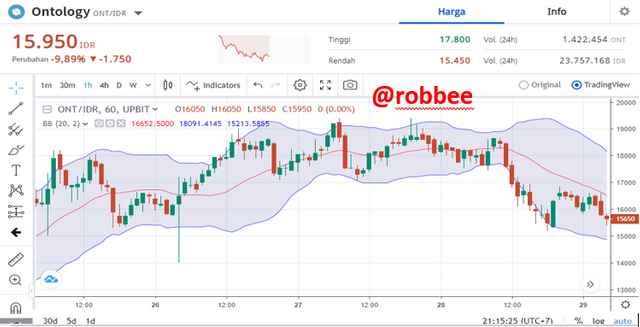
timeframe 1 hours
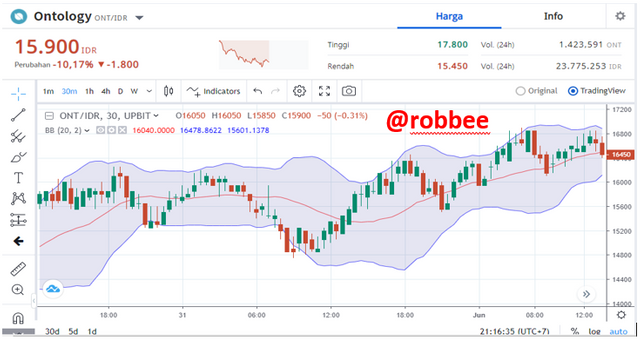
timeframe 30 minute
The above timeframes consist of monthly, weekly, daily, 4 hours, 1 hour and 30 minutes timeframes. Seen on the monthly and weekly charts, the use of the Bollinger band indicator looks like it's not good to watch because of the short timeframe, so it's not good to see it. Meanwhile, on the daily, 4-hour, 1-hour and 30-minute charts the Bollinger band indicator looks better and is good to watch. The smaller the timeframe used, making visualization and observation easier.
6. Review the chart of any pair and present the various signals giving by the indicator Bollinger Bands.
I looked at the coin ontology chart, April 22 to May 22 2021. I use a 4 hour timeframe, here is the graph:
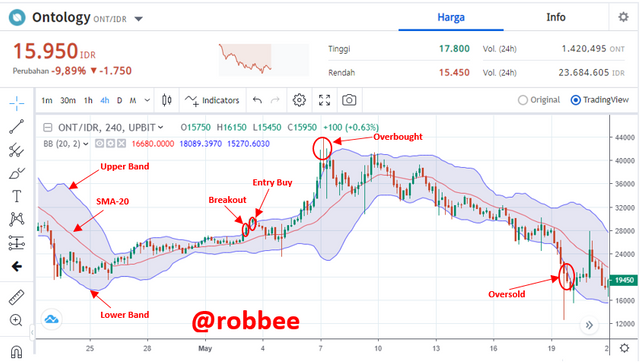
this picture from upbit and edited by me
From the chart above, there are several things that I got based on the use of the Bollinger Bands indicator. The first signal I got was a breakout, the breakout was located on May 3, 2021, at 07.00 with a coin price of 28745 IDR, because at that time the price broke or left the upper band. Meanwhile, not long after that, at around 15.00 the price really got out of the upper band, so based on that, traders are recommended to make an entry buy because the position is trending. Then, the next 4 days, 7 may 2021, there was an overbought or excessive purchase that made the coin price high and penetrated the upper band, which is 43197 IDR, this is a highly recommended time to sell assets. Until May 20, 2021, there was oversold due to the large number of offers in the market which caused the price to decline until it penetrated the lower band, it is time to buy assets.
Conclusion
As a technical indicator for determining the direction of market movements and measuring volatility, Bollinger bands are a very useful indicator. In accordance with the recommendation of John Bollinger, that the best use is the 20-day moving average. In this setting, it is recommended to use 2 standard deviations based on the 20-day moving average. This setting will later make the distance between the Upper and lower bands even further so that it shows a very clear trend, but still requires expertise from traders to identify it in order to get maximum profit
This is everything I know about Cryptocurrency Trading with Bollinger Bands, I'm writing this based on some of the references I've studied.
Hello @robbee,
Thank you for participating in the 8th Week Crypto Course in its second season and for your efforts to complete the suggested tasks, you deserve a 6/10 rating, according to the following scale:
My review :
There is really no best time frame so it depends on your trading style and approach:
An accepted article in which the answers to the questions differed between persuasive and less persuasive. Try to understand the question before proceeding to the answer.
Thanks again for your effort, and we look forward to reading your next work.
Sincerely,@kouba01