Steemit Crypto Academy [Intermediate Level Courses] Season 3 Week 8 Homework by @asaj "Crypto Assets and the Random Index (KDJ)"
Hello steemian ...
This is my new post in the Steemit Crypto Academy community, on this season 3 week 8, I will be working on a homework from professor @asaj with the theme "Crypto Assets and the Random Index (KDJ)”.
we will discuss it through the homework below:
1. In your own words define the random index and explain how it is calculated
random index definition
As we know that indicators are tools that we can use for purposes of analyzing the price movement of an asset, both fundamentally and technically. Likewise with the KDJ Indicator functions well to assist us in reading price movements in the oversold and overbought zones which are marked by 2 horizontal lines, both of which are called XNUMX.
Random index or KDJ is an indicator that is in line with the trend or can be said to follow the trend. The KDJ indicator is calculated based on the lowest price, highest price, and closing price in a certain period. The KDJ indicator has little resemblance to the Stochastic Oscillator and Alligator indicators, the purpose of the three indicators is almost the same.
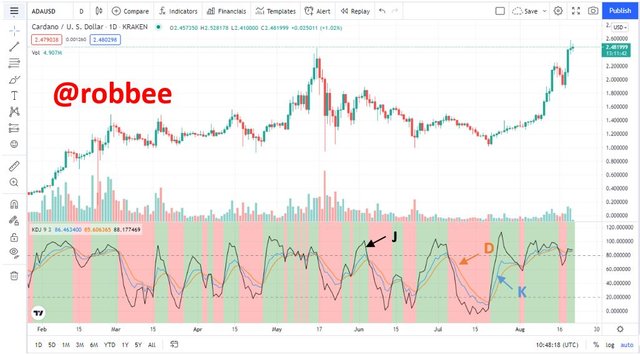
In appearance, the KDJ indicator displays 3 lines called K, D, and J lines. Unlike the Stochastic Oscillator indicator which only displays K and D lines. The J line on the KDJ indicator shows the divergence of the D value from the K value. The J line is the most important because it is used to see the trend, if the J line is above the other two lines then the condition is bullish or an uptrend, otherwise if the J line is below the other two lines then the market condition is bearish or downtrend.
how to calculate it
- Calculation of KDJ must begin by finding the RSV value of the period (day, week, month, and so on). So :
RSV(n) = (Cn x Ln) / (Hn x LNn) x 100
Where:
RSV(n) = RSV value on day n
Cn = closing price on day n
Ln = lowest price on day n
Hn = highest price on day n
- After getting the RSV value, we can directly calculate the value of K and D. The formula is
K(n) = 2/3 x K(n-1) + 1/3 x RSV(n)
D(n) = 2/3 x D(n-1) + 1/3 x RSV(n)
Where :
K(n) = K value on day n
D(n) = D value on day n
K(n-1) = K value on day n-1
D(n-1) = D value on day n-1
*NB: if there is no value of K(n-1)/ D(n-1) then the value of K(n-2)/ D(n-2) can be used or you can replace it with the number 50.
- After obtaining the values of K and D, then the value of J can be found. The formula for J is:
J = 3 x K(n) – 2 x D(n)
2. Is the random index reliable? Explain
Of course, random indexes are reliable. The random index works well to help us read price movements in the oversold and overbought zones which are marked by 2 horizontal lines, both of which are called XNUMX. Then the random index is also very good to rely on when the market is experiencing a trend.
However, this random index is an indicator that is not easy, so users must be proficient in reading it. Beginners are not recommended to use this indicator, this is because random indicators have complicated calculations. For experienced traders, of course, will have their strategy to set the random index as best as possible and combine it with other indicators to get the best results.
But as we know that all indicators are subjective. Everyone certainly has their mainstay indicators. And what should always be kept in mind is that indicators cannot be 100% correct and reliable. It all depends on your abilities. For that, you have to deepen your basics and abilities.
3. How is the random index added to a chart and what are the recommended parameters? (Screenshot required)
add random index to graph
I will do this step on the website https://www.tradingview.com/ :
- First make sure you have entered the website https://www.tradingview.com/, select the chart menu
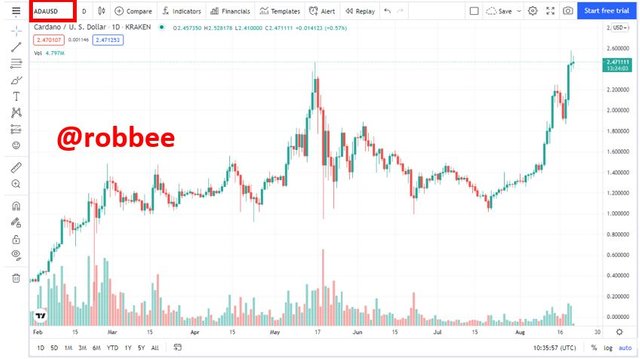
Then you will be shown a graph of the price movement of an asset, in this case, I use the Cardano asset (ADA/USD)
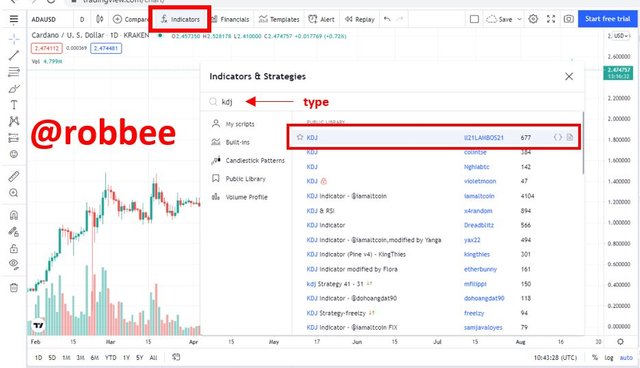
- to add the KDJ indicator, you can directly select the indicators menu, then write down the KDJ indicator and select the indicator.
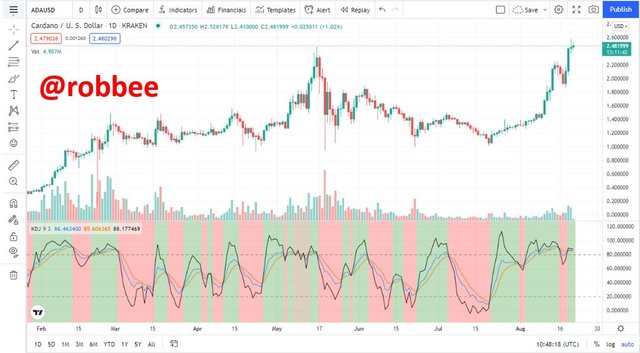
- after the indicator is added to the chart, you can use it right away.
recommended parameters
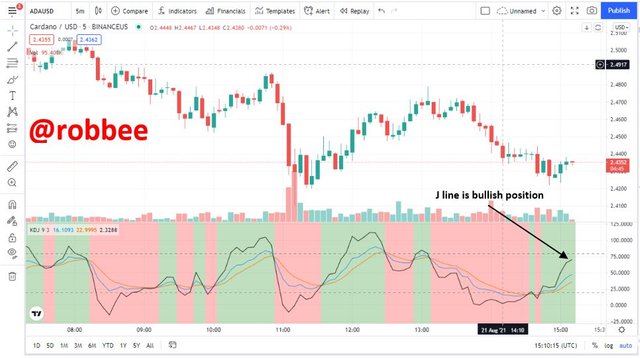
Please note in advance that of the three lines on the indicator, the K line is the blue line, the D line is the orange line and the J line is the black line. The J line is the most important because it is used to see the trend, if the J line is above the other two lines then the condition is bullish or an uptrend, otherwise if the J line is below the other two lines then the market condition is bearish or downtrend.
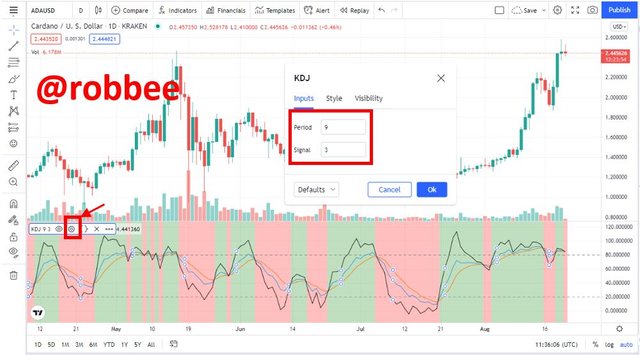
The recommended parameter for this KDJ indicator, you should change the period to 9 and the signal to 3. You can do this in the settings and the inputs menu.
Then, for the use of this indicator, it is not recommended with a small timeframe. We recommend that you use a larger timeframe such as 1 day and above.
4. Differences between KDJ, ADX, and ATR
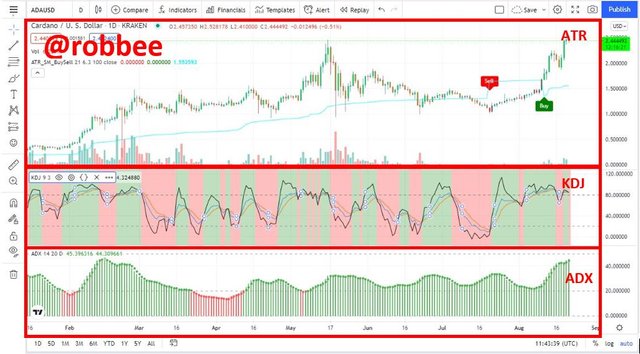
Before discussing the differences in KDJ, ADX, and ATR further, we must first look at the shape of the KDJ, ADX, and ATR indicators when applied to charts. Here is how it looks plotted together:
Differences from display:
- KDJ has a display that represents sharp and winding lines, to pay attention to price movements must be more detailed.
- ADX has a display that represents a simplified line into a wave so that the price movement is easier to see.
- ATR has a display that resembles a moving average indicator, it is more difficult to read price movements, but this indicator immediately shows buy and sell orders.
Different from usage:
- KDJ focuses more on the J line to determine price movements. (helps traders in reading the direction of the trend)
- ADX relies on a simple appearance, green and red colors represent candlesticks and waves represent trends. (wavelength also shows the strength and direction of the trend)
- ATR is a bit difficult to watch the price movement, but there are buy or sell orders that make it easy. (This indicator is good to use to determine market volatility.
5. Use the signals of the random index to buy and sell any two cryptocurrencies. (Screenshot required)
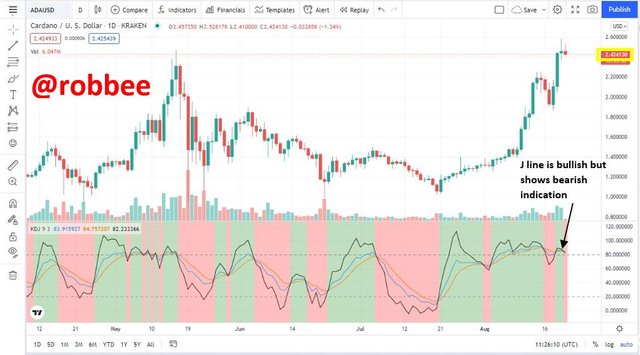
- I made a Cardano asset purchase (ADA) at 11:26 UTC. The price of ADA is 2424, I bought 20 USD then I got 8.25 ADA. At the time of buying, the candlestick is small red and shows an indication that there will be a price reversal to a downtrend position. The random index signal also shows the J line above the position of the K and D lines, which means the market is in an uptrend. However, the J line shows an indication that it will decline.
- Then at 15:10 UTC, I sold the ADA asset for 2,435 USD. It can be seen that the indication of bullishness at the time of buying took place, but the asset went back up and I also secured a 4.43% profit, which was 0.887 USD. At 15.10 UTC, it appears that the random index signal indicates that a bullish position will occur, namely, the J line is above the position of the K and D lines.
conclusion
The random index works well to help us read price movements in the oversold and overbought zones which are marked by 2 horizontal lines, both of which are called XNUMX. Then the random index is also very good to rely on when the market is experiencing a trend.
However, this random index is an indicator that is not easy, so users must be proficient in reading it. Beginners are not recommended to use this indicator, this is because random indicators have complicated calculations. For experienced traders, of course, will have their strategy to set the random index as best as possible and combine it with other indicators to get the best results.
But as we know that all indicators are subjective. Everyone certainly has their mainstay indicators. And what should always be kept in mind is that indicators cannot be 100% correct and reliable. It all depends on your abilities. For that, you have to deepen your basics and abilities.

Hi @robbee, thanks for performing the above task in the eighth week of Steemit Crypto Academy Season 3. The time and effort put into this work is appreciated. Hence, you have scored 5.5 out of 10. Here are the details:
Remarks
Overall, you have displayed a good understanding of the topic. You have performed the assigned task. However, you did not provide new information to this course, as most of the points mentioned have been indicated by several participants.