Steemit Crypto Academy [Intermediate Level Courses] Season 3 Week 4 Homework by @asaj "Spotting Market Reversals With CCI"
Hello steemian ...
This is my new post in the Steemit Crypto Academy community, on this season 3 week 4, I will be working on a homework from professor @asaj with the theme "Spotting Market Reversals With CCI”.
SOURCE: https://traderrr.com/id/osilator-cci-commodity-channel-index-definisi-dan-penggunaan/
the Commodity Channel Index (CCI) was first created in 1980 by a man named Donald Lambert. The Commodity Channel Index (CCI) was created to make it easier for humans to trade commodities. The Commodity Channel Index (CCI) is created based on measuring the difference between the middle price, price movement, and the average middle price over a certain period.
For a more specific explanation of this, I will explain it based on the task below:
1. Open a demo account on any trading broker and select five cryptocurrency pairs

In this case, the trading broker I chose was upbit exchange. The reason is that I already have an account on this platform. The five cryptocurrency pairs I chose are:
- SteemDollars (SBD)
- STEEM
- Ontology (ONT)
- dCargo (DKA)
- Uniswap (UNI)
2. Create a market entry and exit strategy
In this market entry and exit strategy, I will analyze it without using certain indicators. I use a simple method, namely by determining the support and resistance areas. when there is support then it's time you enter, while when there is resistance then it's time for you to get out.
- SteemDollars (SBD)
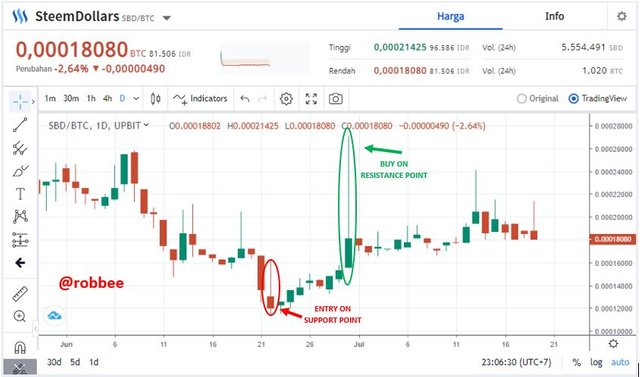
In the chart above, it can be concluded that the best support point occurred on June 22 for 0.00011408 BTC, it is time for you to enter. Then on June 30, there was a price increase which is the best resistance point at 0.00027042 BTC, it's time for you to get out.
- STEEM
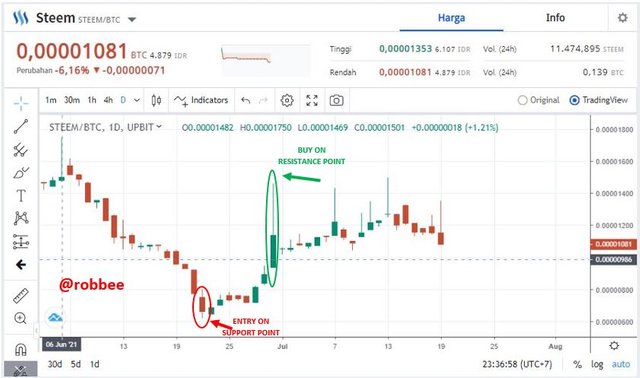
In the graph above, it can be concluded that the best support point occurred on June 22 for 0.00000607 BTC, it is time for you to enter. Then on June 30, there was a price increase which is the best resistance point at 0.00001465 BTC, it's time for you to get out. The STEEM and SBD markets often have similarities in their market price movements, this is of course because the two coins are very closely related.
- Ontology (ONT)
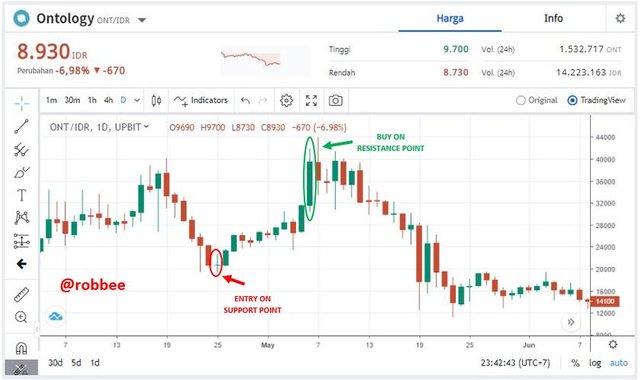
In the graph above it can be concluded that the best support point occurred on April 25 for 19542 IDR, it is time for you to enter. Then on May 6th, there was a price increase which is the best resistance point at 41603 IDR, it's time for you to get out.
- dCargo (DKA)
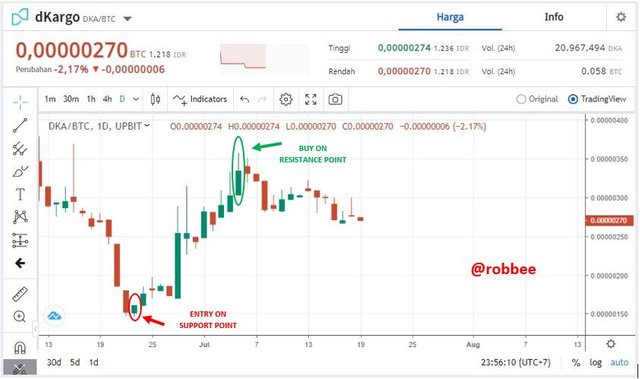
In the graph above, it can be concluded that the best support point occurred on June 23 for 0.00000146, it is time for you to enter. Then on July 5th, there was a price increase which is the best resistance point at 0.00000357 IDR, it's time for you to get out.
- Uniswap (UNI)
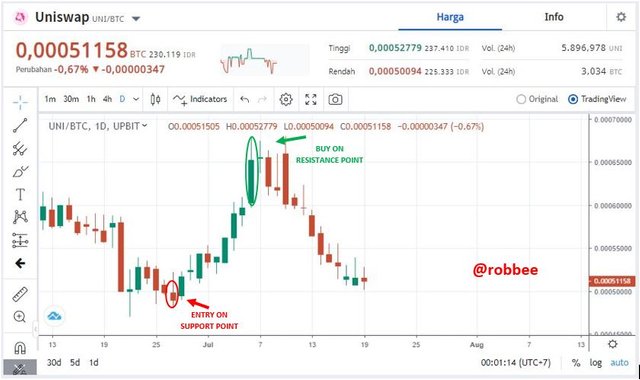
In the graph above, it can be concluded that the best support point occurred on June 27 for 0.00048053, it is time for you to enter. Then on July 5th, there was a price increase which is the best resistance point at 0.00067902 IDR, it's time for you to get out.
3. Use the signals of the Commodity Channel Index (CCI) to buy and sell the coins you have selected
I will use the commodity channel index (CCI) signal, at this stage I will show you how to use it to buy and sell:
- SteemDollars (SBD)
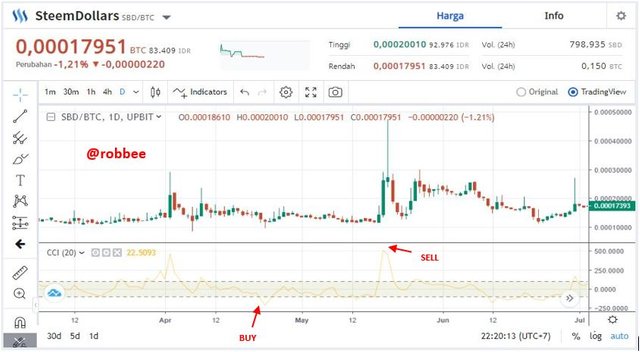
According to the Commodity Channel Index (CCI) in the chart above, a buy signal was shown on April 23, with a price of SBD 0.00009979 BTC. This point is the point where the price will start to increase. While the signal indicates that May 19 is the time to sell, the price shows the highest increase of 0.00028890 BTC and after that, it will experience a very significant price decline.
- STEEM
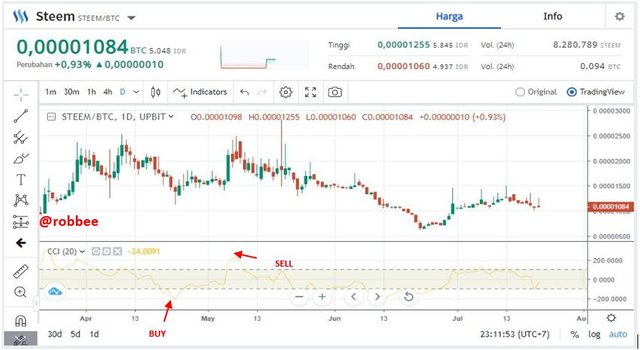
According to the Commodity Channel Index (CCI) in the chart above, a buy signal was shown on April 23, with a STEEM price of 0.00001128 BTC. This point is the point where the price will start to increase. While the signal indicates that May 8 is the time to sell, the price shows the highest increase of 0.00002441 BTC and after that, it will experience a very significant price decline.
- Ontology (ONT)
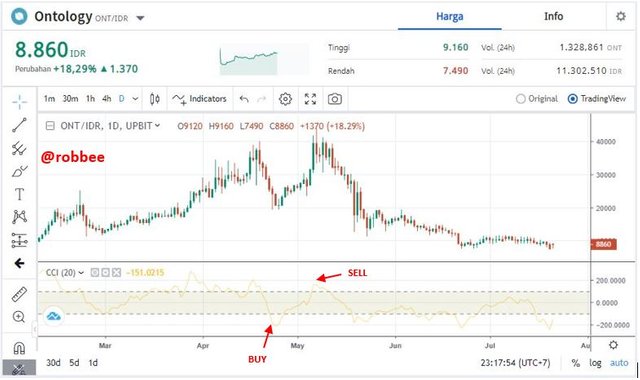
Based on the Commodity Channel Index (CCI) in the chart above, a buy signal was shown on April 23, with a price of ONT 19564 IDR. This point is the point where the price will start to increase. While the signal shows that May 7th is the time to sell, the price shows the highest increase of 42610 IDR and after that, it will experience a very significant price decline.
- dCargo (DKA)
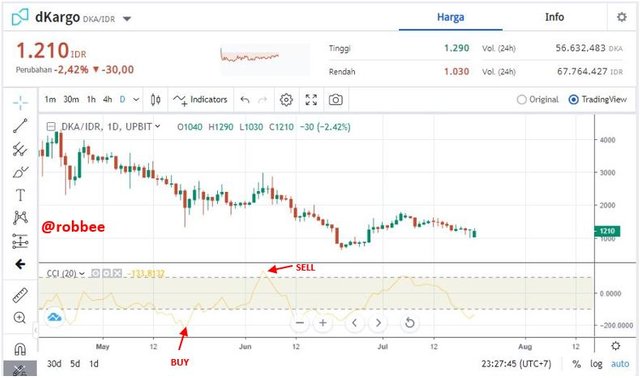
Based on the Commodity Channel Index (CCI) in the chart above, a buy signal was shown on 19 May, with a price of ONT 1365 IDR. This point is the point where the price will start to increase. While the signal shows that June 5 is the time to sell, the price shows the highest increase of 2979 IDR and after that, it will experience a very significant price decline.
- Uniswap (UNI)
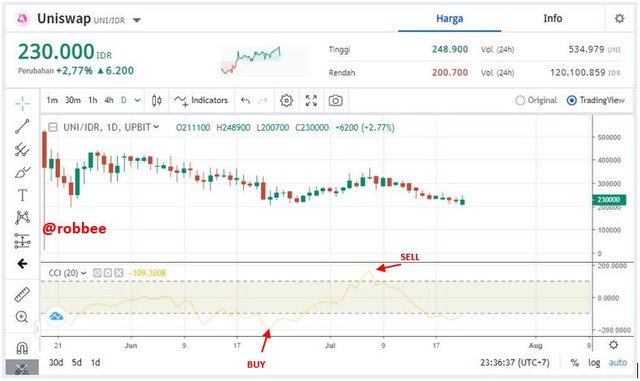
Based on the Commodity Channel Index (CCI) in the chart above, a buy signal was shown on June 22, with a price of ONT 199134 IDR. This point is the point where the price will start to increase. While the signal shows that July 7 is the time to sell, the price shows the highest increase of 362811 IDR and after that, it will experience a very significant price decline.
4. Declare your profit or loss
At this stage, I will explain my profit and loss after buying crypto assets.
SteemDollars (SBD)
I bought SBD at 16.01 UTC 7/21/2021, I bought 5 SBD. 1 SBD at that time cost 83,354 IDR, so the total was 416,770 IDR. Then at 23.06 UTC 2/21/2021, I will sell all the coins, at that time the price of 1 SBD is 83,600 and the total is 418,000 IDR. So, I also get profit 1,230 IDR (1.48% Profit)STEEM
I bought STEEM at 16.05 UTC 7/21/2021, I bought 50 STEEM. 1 SBD at that time was 5,054 IDR, so the total was 252,700 IDR. Then at 23.07 UTC 7/21/2021, I will sell all the coins, at that time the price of 1 STEEM is 5,113 and the total is 255,650 IDR. So, I also get profit 2,950 IDR (1.16% Profit)Ontology (ONT)
I bought ONT at 16.13 UTC 7/21/2021, I bought 30 ONT. 1 ONT at that time was 8,850 IDR, so the total was 265,500 IDR. Then at 23.08 UTC 7/21/2021, I will sell all the coins, at that time the price of 1 ONT is 8,820 and the total is 264,600 IDR. So, I also get loss 900 IDR (loss 0.34%)dCargo (DKA)
I bought DKA at 16.19 UTC 7/21/2021, I bought 200 DKA. 1 DKA at that time cost 1,200 IDR, so the total was 240,000 IDR. Then at 23.09 UTC 7/21/2021, I will sell all the coins, at that time the price of 1 DKA is 1210 and the total is 242,000 IDR. So, I also get profit 2000 IDR (0.83% Profit)Uniswap (UNI)
I bought UNI at 16:37 UTC 7/21/2021, I bought 5 UNI. 1 UNI at that time was worth 244,400 IDR, so the total was 1,222,000 IDR. Then at 23:10 UTC 7/21/2021, I will sell all the coins, at that time the price of 1 UNI is 240,700 and the total is 1,203,500 IDR. So, I also get a loss 18,500 IDR (1.51% loss)
5. Explain your trade management technique
In my daily trading management technique, I don't use indicators much for my trade management. I usually only rely on the support and resistance areas, but even so I also often use the Bollinger bands indicator. This is because the Bollinger band indicator is very easy to analyze, for example, if a candlestick rises through the upper band, then it is time to buy, and vice versa if it falls through the lower band, then it is time to sell. Therefore, I can only say that my trading technique is to prioritize ease and my analysis is also only basic and not very detailed, in that case, it cannot be denied that instinct is also needed even though in reality it will only leave us guessing.
Conclusion
The Commodity Channel Index (CCI) is one type of indicator that has good benefits in terms of helping traders read charts. The Commodity Channel Index (CCI) can compile small graphs that are difficult to analyze into a more readable graph form. However, for the problem of chart analysis, of course, everyone has their mainstay indicator, because everyone will certainly choose which one he thinks is easier and more efficient to use.
Hi @robbee, thanks for performing the above task in the fourth week of Steemit Crypto Academy Season 3. The time and effort put into this work is appreciated. Hence, you have scored 5.5 out of 10. Here are the details:
Remarks:
Commendable effort but fair performance. It appears you do not fully understand the concept of support and resistance. The manner in which you performed the second task gives this impression. As a suggestion, do some research on it. Support or resistance line isn't drawn by circling a single candlestick.
Additionally, while performing the third task, it is advisable not to rely on a single indicator. It would have been better see you confirm or reject the CCI signals using other indicators.
As for the fourth task, the manner in which you declared your profit isn't particularly alluring. Even so, there's no screenshot to back your claim. That said, we appreciate the effort you put into this work.
thanks prof