Steemit Crypto Academy [Beginner Level Courses] Season 4 Week 2 Homework by @lenonmc21 "Basic trading strategy using the Harmonic AB = CD + Fibonacci pattern"
Hello steemian ...
This is my new post in the Steemit Crypto Academy community, on this season 4 week 2, I will be working on a homework from professor @lenonmc21 with the theme "Basic trading strategy using the Harmonic AB = CD + Fibonacci pattern”.
.png)
we will discuss it through the homework below:
1. Define in your own words what Harmonic Trading is?
Trading cannot be done arbitrarily if you want to make a profit, one ability that is arguably very important is the ability to know the patterns that form on the chart, one of the techniques that are often used by forex traders to read patterns on price charts is the harmonic trading technique.
Harmonic trading is a technique for forming patterns on price charts using the Fibonacci ratios as a benchmark for drawing harmonic patterns. Many people think that harmonic trading was developed by Scott Carney who has written a book entitled "Harmonic Trading". Before Scott Carney wrote his book, many experts discussed harmonic trading, such as HM Gartley in 1932 who wrote a book about a pattern with five points, the book was entitled "Profits in the Stock Market". HM Gartley was the first to propose the harmonic trading technique, then HM Gartley's idea was developed by Larry Pesavento in his book entitled "Fibonacci Ratios with Pattern Recognition" by re-examining the pattern with five points on the Fibonacci ratio and also testing trading procedures with the same pattern. Gartley made. The patterns that have formed on the price chart will always repeat themselves, even though the repetition does not have a 100% similarity but will be very similar and that is the basis of the harmonic trading technique.
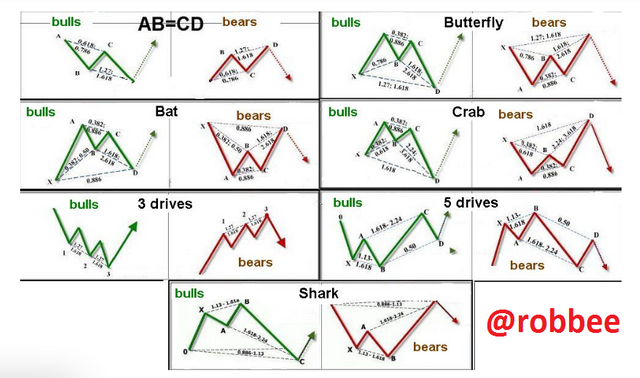
Several kinds of harmonic trading patterns can be used, such as Bullish/Bearish AB=CD, Bullish/Bearish Bat, Bullish/Bearish 3 drives, Bullish/Bearish Butterfly, Bullish/BearishCrab, Bullish/Bearish 5 Drives, Bullish/Bearish Shark, and other.
2. Define and Explain what the pattern AB = CD is and how can we identify it?
Previously, we already knew that this harmonic trading has several patterns that can be used, one of the simplest and easiest patterns to use is the AB=CD pattern because the AB=CD pattern only uses 4 points, point A, point B, point C, and point D, this AB=CD pattern is shaped like a wave formed from the Fibonacci ratio. One of the characteristics of the AB=CD pattern is that the length of AB is approximately equal to the length of CD. This AB=CD pattern also has two form conditions, namely Bullish AB=CD and Bearish AB=CD. If the pattern is formed into Bullish AB=CD, when the pattern that we drew up to point D follows the conditions for the formation of Bullish AB=CD, then we should be able to purchase because there is a possibility that the price could rise. conversely, if a Bearish AB=CD pattern is formed, it is better to sell tips because there is a possibility that the price will fall. To find out the pattern AB=CD, we must identify it on the price chart. Here's how to identify the pattern AB=CD.
- Bullish AB=CD
As previously explained, to identify bullish AB=CD, the price chart must go down, to identify bullish AB=CD we must follow the specified conditions.
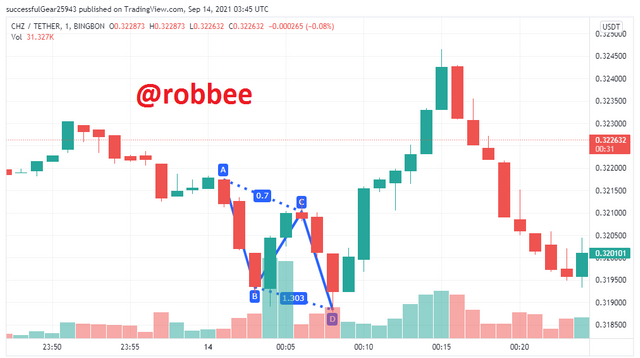
The first time we have to determine point A and point B, here point A as swing high and point B as swing low. For the determination of points A and B, we place them on a descending graph, but we must also pay attention to the placement of point C. The condition for the placement of point C is that point C must be between points A and B, the placement of point C must also be between 61.8% to 78.6 % Fibonacci retracements of the distance between A to B. As shown below:
Point C is at the 70% Fibonacci retracements from the distance A to B, then points A, B, and C can be used, and then the determination of point D.
For determining point D we have to do Fibonacci retracements from point B to point C. Determining point D is almost the same as determining point C, but at point D point B is a swing low, and point C is a swing high. For point, D must be between 127% to 161.8% of the Fibonacci retracements distance B to C so that point D is below point B.
As shown above, the location of point D is at 130.3% Fibonacci retracements distance B to C, and the Bullish AB=CD pattern is fully formed.
- Bearish AB=CD
To identify Bearish AB=CD the chart must go up. To identify Bearish AB=CD, just as we identify Bullish AB=CD, the difference is Bullish when the chart goes down while Bearish when the chart goes up.

At Bearish AB=CD, point A is a swing low and point B is a swing high, and just like Bullish AB=CD, the location of point C is above point A and the placement of point C is between 61.8% to 78.6% of the distance from A to B.
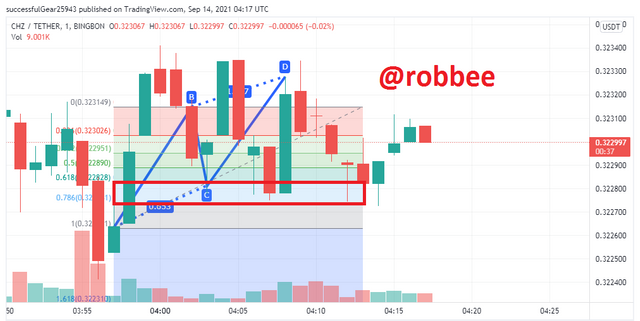
in the example above, the location of point C is at 65.3% Fibonacci retracements distance A to B, then points A, B, C can be used, then determining point D.
To determine point D, point B as a swing high and point C as swing low. Point D is always above point B, and point D must be between 127% to 161.8% of the Fibonacci retracements distance B to C.
In the picture above point, D is located at 138.7% distance BC, then the Bearish AB=CD pattern is fully formed.
3. Clearly describe the entry and exit criteria for both buying and selling using the AB = CD pattern?
Harmonic trading has two pattern states, namely bullish which means the chart is declining and if a bullish pattern is formed then we should enter the market to buy it while the second is bearish i.e. when the price chart is rising and if a bearish pattern is formed then we should enter the market to make a sale. The following are the criteria for entry and exit.
- entry criteria
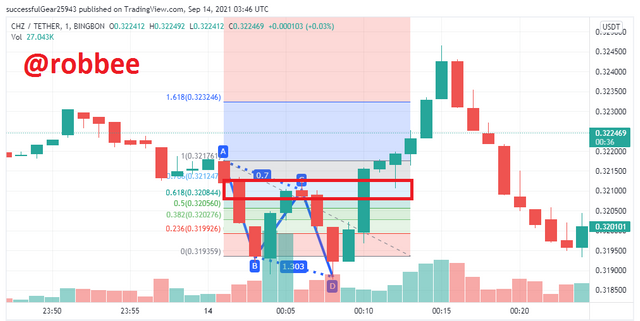
At first, we identify the chart pattern we are analyzing, because we use the AB=CD pattern, we only identify 4 points, points A, B, C, and D. After we find 4 points, we must confirm that point C is between 61.8 % and 78.6% Fibonacci retracements the distance of point A to B, and point D is between 127.2% and 161.8% Fibonacci retracements of distance B to C. If both conditions are not met, then the pattern AB=CD cannot be used and we must look for the pattern again it on the price chart. Here I will use the example in question no 2.
In the picture above, the bullish pattern AB=CD has been formed by fulfilling two conditions as I said before. When the price has touched point D, we have made a purchase entry with a profit target commonly used in harmonic trading, at least 70% of the distance from point D to C.
- exit criteria
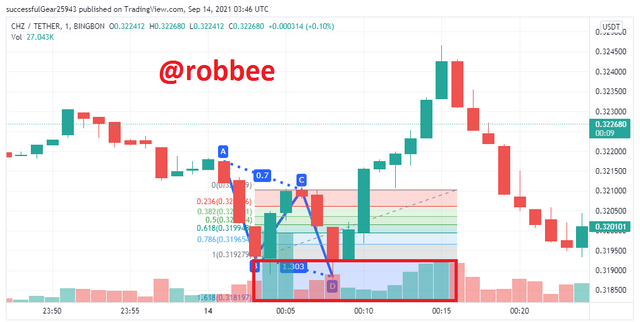
In the market, we can not guarantee a 100% profit. So we need to place a stop loss below the potential reversal zone. This potential means that the price chart may reverse direction before touching point D or it could be that the price chart will continue to follow the existing trend. Then the pattern that we were going to form earlier failed to form. If that happens we should immediately get out of the market. Therefore we should always place a stop loss at 2% above D.
Practice (Only Use your own images)
1. Make 2 entries (Up and Down) on any cryptocurrency pair using the AB = CD pattern confirming it with Fibonacci.
- Bullish AB=CD

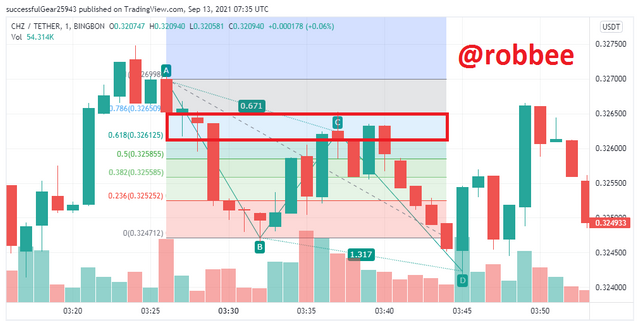
In the picture above point, C is located at 67.1% Fibonacci retracements distance A to B, which means point C still meets the requirements for the formation of the AB = CD pattern. Point D is located at 131.7% Fibonacci retracements, distance B to C, which indicates that point D still meets the requirements for the formation of the AB=CD pattern. From the picture above, it indicates that the bullish pattern AB=CD is perfectly formed and it is evident that the price chart rose after touching point D.
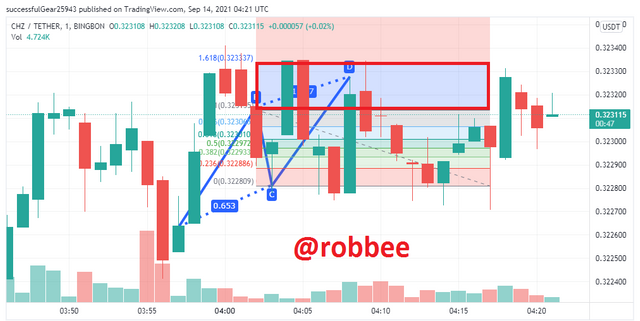
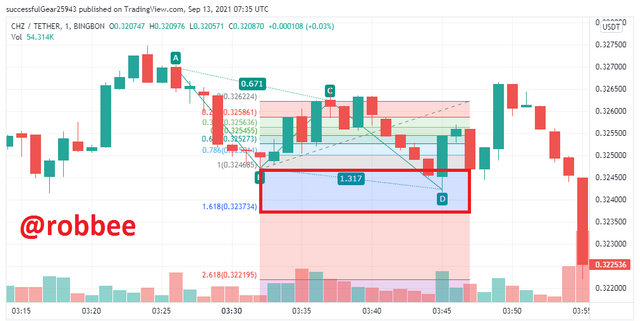
- Bearish AB=CD

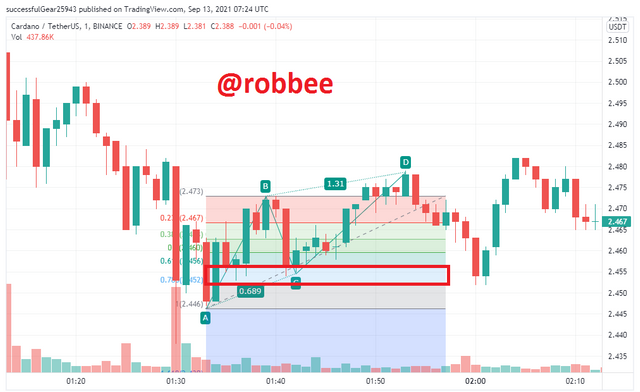

In the picture above point, C is located at 68.9% Fibonacci retracements distance A to B which indicates point C still meets the requirements for the formation of the AB = CD pattern. Point D is located at 131% Fibonacci retracements distance B to C. Because point C and point D meet the requirements of the formation of the AB=CD pattern, the picture above forms a perfectly bearish AB=CD pattern and it is proven that after the price touches point D the price chart goes back down again.
Conclusion
Harmonic trading is a good technique to learn more about. There are still many harmonic trading patterns that we can learn on our own. Although some people say that harmonic trading is difficult to learn, but in my opinion if there is a desire for harmonic trading it will be easy to learn and I enjoy learning this harmonic trading.
References:
https://www.pelatihanprofitinternasional.com/edukasi-harmonic-pattern-untuk-trading-forex/
https://www.seputarforex.com/artikel/teknik-trading-dengan-harmonic-pattern-284557-31
https://www.foreximf.com/blog/strategi-forex-trading-kunci-sukses-paham-harmonic-pattern-4
https://www.indotradefx.com/id/education/forex-tutorials/harmonic-patterns-abcd
https://www.tradingview.com/chart/ITAaNOcQ/
Fibonacci retracement levels are a popular tool used by traders to identify turning points for cryptocurrency prices. Without this tool, traders can get into Crypto operations without confidence, which can lead to unnecessary losses.
While the Fibonacci recovery tool is widely used in the traditional stock market or forex market, you will be surprised to know that it works very well in cryptocurrency markets.