S4W2 - Homework Post for [Professor @reminiscence01] Technical Indicators
Hello steemian ...
This is my new post in the Steemit Crypto Academy community, on this season 4 week 2, I will be working on a homework from professor @reminiscence01 with the theme "Technical Indicators”.
we will discuss it through the homework below:
1. a) In your own words, explain Technical indicators and why it is a good technical analysis tool.
In the trading world, there is a various technical analysis that can be used by traders to gain profits in trading. Technical analysis is an analytical technique that is often used by traders to predict price increases or trends in a market, traders usually observe patterns of price increases that can be used as a basis for selling or buying. One of the technical analyses is using the indicator technique. Indicator techniques are tools created from mathematical calculations in the form of a line or the like on a price chart that can help traders to assess market conditions so that traders can predict future price charts. Simply put, the indicator technique helps us to get buy and sell signals on the price chart. We can also use this indicator technique to confirm the analysis that we have done so that we can be more confident in making decisions.
Indicators are a good technical tool because they can help us predict future price increases or decreases, indicators can also give us signals to enter or exit the market, and indicators can help us confirm other technical analyses that we have done.
b) Are technical indicators good for cryptocurrency analysis? Explain your answer.
As I explained in the previous question, this indicator can help us predict future price chart increases, give us accurate signals for future analysis, and the indicator can also be a tool to confirm other technical analyses. So indicators are very good to use for cryptocurrency analysis, so if you want to do cryptocurrency analysis using indicators, you should use the easiest indicator according to us personally, and also if we can master more than one indicator it would be better if we did cryptocurrency analysis using more than one indicator, The more indicators we use, the better and more accurate the results of our analysis will be.
c) Illustrate how to add indicators on the chart and also how to configure them. (Screenshot needed).
To use the indicator on the price chart, I am here using the tradingview site in the process.
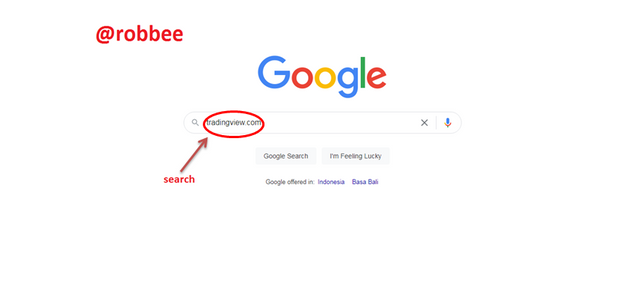
Step 1:
On the google menu, search for trading view by typing www.tradingview.com on the google menu as shown below.
Step 2:
When you have entered the tradingview site, then click on the chart to go to the price chart.
.png)
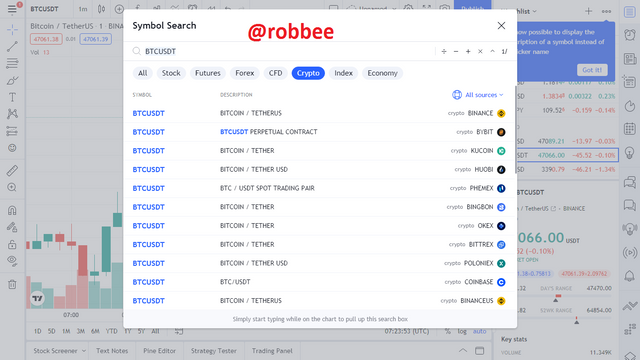
Step 3:
Before we do technical analysis, we should choose the coin we want to use first, here I use Bitcoin/TetherUS.
Step 4:
When the price chart appears, to add an indicator to the price chart, press indicators & Strategies at the top.
.png)
Step 5:
Here, we choose the indicator that we want to use for analysis, and here I take the example of using moving averages to perform technical analysis because the moving average is one of the most widely used indicators and is an easy indicator to use. If we want to use other indicators, then we can search and select the indicators we want to use.
.png)
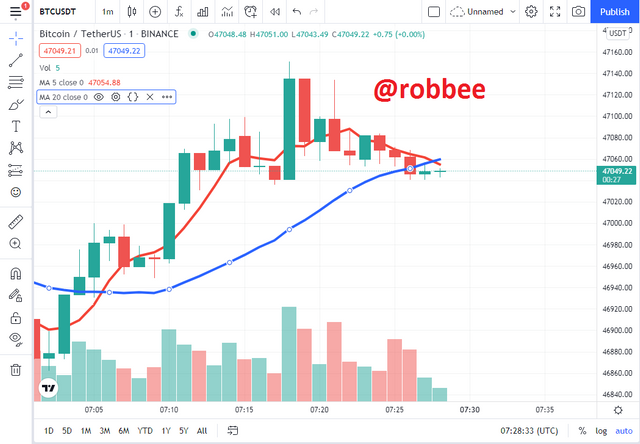
Step 6:
Here I want to use two moving average indicators to do the analysis. Before we start the analysis, we have to configure it to make it easier for us to do the analysis later.
Step 7:
To change the line settings, click the settings in the section that I show in the image below. In the input menu, we can set Indicator Timeframe, Length, Source, offset. In this input menu, I only set the Length. And I used two types of Moving Average, for the first I used Length 5 which was written to MA5 and for the second I used length 20 which was written to MA20.
.png)
Step 8:
For the style menu, we can change the line color, line thickness, line shape, and the like as we want to make it easier to read the chart later.
.png)
Step 9:
And here is the finished indicator display.
2. a) Explain the different categories of Technical indicators and give an example of each category. Also, show the indicators used as an example on your chart. (Screenshot needed).
There are three categories of indicator techniques that can be used to perform price chart analysis. When these categories are used based on their respective different functions. There are three categories of indicators that can be used:
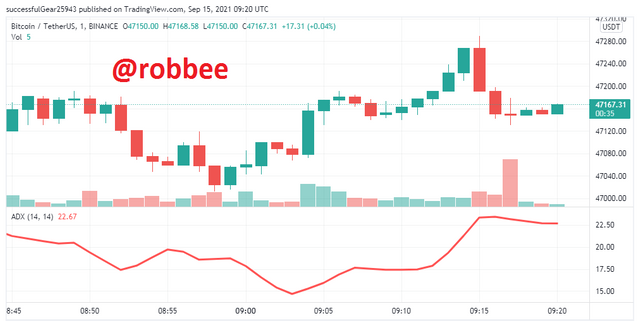
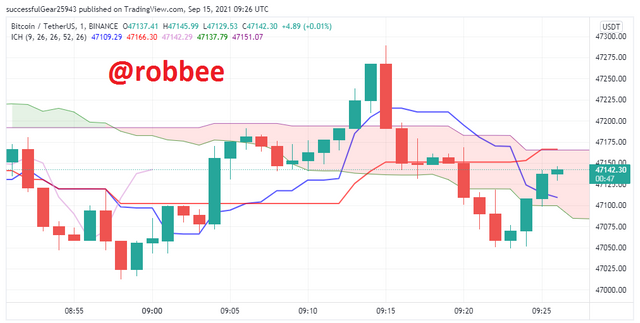
1.) Trend Based Indicator
As the name suggests, Trend Based Indicator is an indicator to help traders analyze whether there will be an Uptrend or Downtrend in the future. In the Trend Based Indicator there are several types of trends that can be used:
- Moving Averages
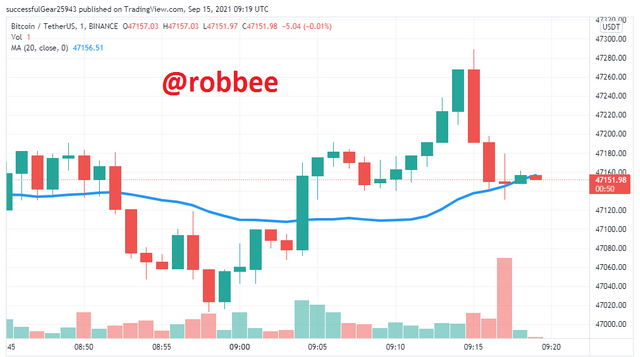
- Averages Directional Index
- Ichimoku Kinko Hyo, etc
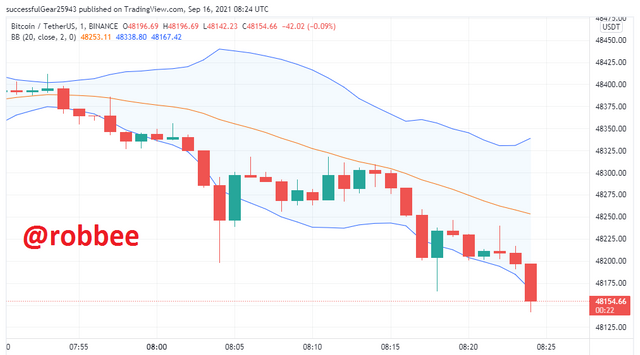
2.) Volatility Based Indicator
Fluctuations in the market will always change from time to time, we cannot immediately say that the price is the highest or lowest price before we do technical analysis. A volatility Based Indicator is an indicator that can help us in analyzing prices when they are high (swing high) and when prices are low (swing low). In volatility-based indicators, several types of indicators can be used:
- Bollinger Bands.
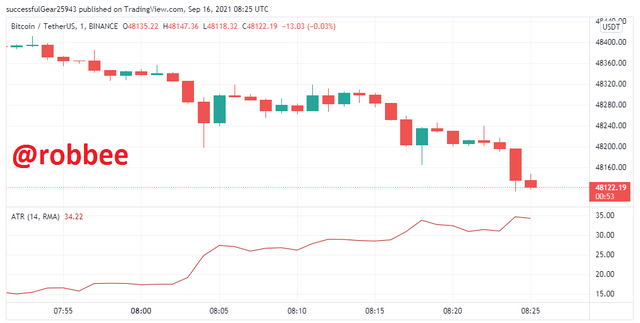
- Average True Range (ATR), etc
3.) Momentum-Based Indicator
Momentum-Based This indicator serves to help us know when the market will be oversold and when the market will be overbought. In the Momentum-Based Indicator there are several types of indicators that we can use:
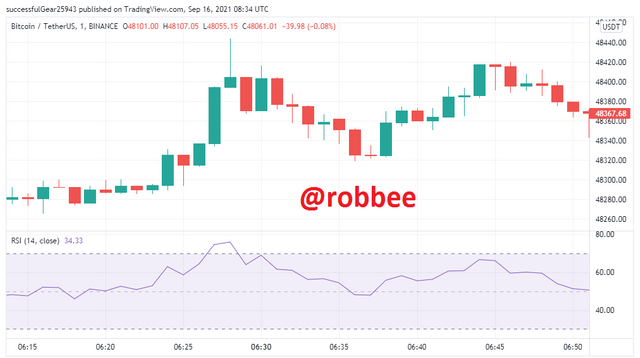
- Relative Strength Index (RSI)
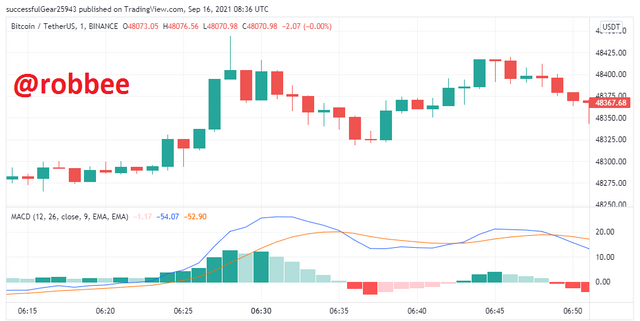
- Moving Average Convergence Divergence (MACD)
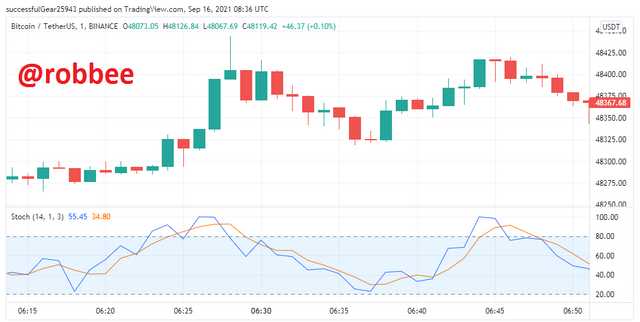
- Stochastic, etc
b) Briefly explain the reason why indicators are not advisable to be used as a standalone tool for technical analysis.
No creation is perfect, neither are indicators. Although indicators can help us predict the rise and fall of market prices easily, they are not perfect tools that we can use as the main analysis. The proof is that indicators are often used as a tool to help confirm the results of other technical analyses, such as trend analysis, support & resistance analysis, chart pattern analysis, candlestick patterns. Therefore, it is not recommended to only use indicator analysis to conduct market analysis, you should use indicators as a tool that helps us to confirm the results of other technical analyses to provide more benefits for traders.
c) Explain how an investor can increase the success rate of a technical indicator signal.
We already know the use of technical indicators, there are many things we can do using this indicator, one of which is an indicator that can give us a signal to do analysis and help confirm other technical analyses. Investors can increase signals on indicators to increase success when trading, by using more than one indicator when conducting technical analysis and using at least two different indicators but having one category of the same indicator.
conclusion
The conclusion that I can take from this lesson is that technical indicators are very useful and can really help us as traders to gain profits in the market. The use of indicators is also very easy to understand and I'm sure everyone can use indicators. Indicators should be used as a tool to confirm the analysis of other techniques so that the analysis results are better and better.
References:
https://juruscuan.com/belajar/trading/492-4-indikator-analisis-teknikal-paling-populer
https://coinvestasi.com/trading-bitcoin/panduan/cara-analisa/apa-itu-indikator
https://www.gicindonesia.com/jurnal/artikel/apa-itu-indikator-forex/
https://www.tradingview.com/chart/ITAaNOcQ/
Hello @robbee, I’m glad you participated in the 2nd week Season 4 of the Beginner’s class at the Steemit Crypto Academy. Your grades in this task are as follows:
Observations:
That's correct.
Not accurate always.
Recommendation / Feedback:
Thank you for submitting your homework task.