REPOST Understanding Trends - Crypto Academy / S5W1- Homework Post for @reminiscence01
Hello steemian ...
this is a repost assignment from professor @reminiscence01.
This is my new post in the Steemit Crypto Academy community, on this season 5 week 1, I will be working on a homework from professor @reminiscence01 with the theme "Understanding Trends”.

we will discuss it through the homework below:

- a) What do you understand by a Trending market?
b) What is a bullish and a bearish trend? (screenshot required)
a) What do you understand by a Trending market?
Trending market is a place to see prices and ongoing transactions in the market and also a place to buy and sell assets owned. This process is also carried out with long-term transactions or can be called trading activities in the form of investments, stocks, and crypto.In a trending market is one thing that can give an idea that the market is trending or just starting, and can also find out the strength of sellers and buyers in an asset, so that it can see demand that continues to increase in large numbers. To get big profits, you must also have the ability to read the market direction and determine which market you want to work in.
As currently many people are in the crypto world because the market moves so fast and can provide profits of up to thousands of percent. With the trading market, it makes it easier to buy assets and sell assets they have and can monitor what trends are happening in the market.
b) What is a bullish and a bearish trend? (screenshot required)

In the trading market, there are two trends that can give an idea of whether prices are strengthening or weakening. Here are the two trends:
Trend Bullish
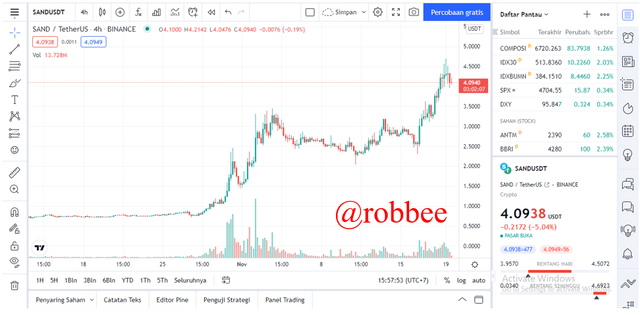
It is a market condition that has a continuous strengthening for a certain period. The philosophy of bullishness itself is from the movement of the bull pushing upwards, which means that the market is moving upwards.As for other terms of bullish such as an uptrend, usually a bullish trend occurs due to the demand of the market is so large and the purchase of assets on a large scale so that the market moves upward, a bullish trend occurs so that it can help traders determine a good entry position during the trend period. The following is an example of a bullish trend which can be seen in the following chart
Trend Bearish
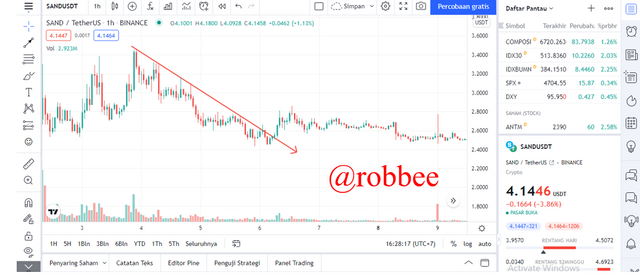
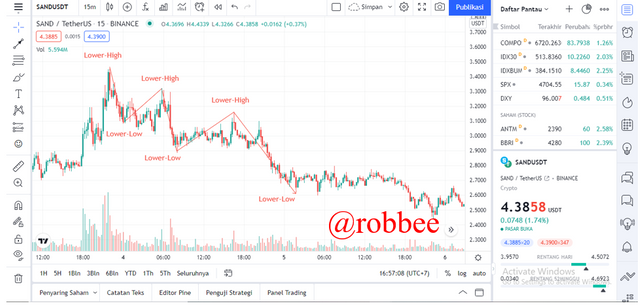
This is where market conditions are experiencing a decline or weakening. The weakening occurs because many traders sell their assets, so the price continues to weaken. Bearish philosophy is like a bear that is crashing from the top to the bottom, another term for bearish is a downtrend. This condition is formed when the lower high is higher than the lower low. The following is an example of a bearish trend on the chart:
2.) Explain the following trend identification and give an example of each of them. (Original screenshot needed from your chart). Do this for a bullish and a bearish trend.
i) Market Structure.
ii) Trendlines
i) Market Structure
The market structure aims to give traders an idea that the market is in a bullish trend or is in a bearish trend by looking at the candlestick chart so that they can identify the current market.
Trend Bullish
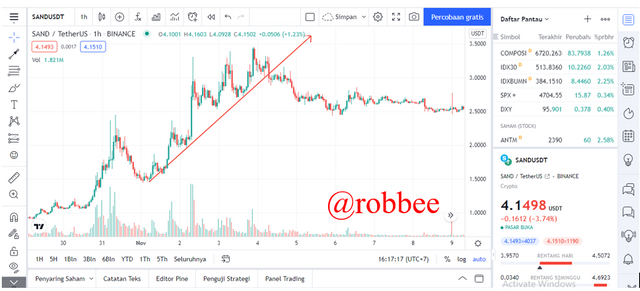
This is where the trend tends to move up, and has a small correction or decline for a higher increase. The characteristics of a bullish trend occur when the candlestick chart forms a higher high (higher point than the previous high) and higher low (lower point that is higher than the previous one).If the higher low is connected, if the trend line is pulled, there will be a small decline in the uptrend. The following is an example of a bullish trend on the chart:
Trend Bearish
The bearish trend is the opposite of the bullish trend where the price has a downward trend. In the bearish trend, the lower high (lower high) and lower low (lower low) point in this trend, there is a rebound in which the conditions are increasing. So short. The following is an example of a bearish trend on the chart:
ii) Trendlines
Trendline is a tool or a line that is useful to help identify price movements in the market, this trendline is very easy to use just by drawing a line. This trendline can help determine support and resistance levels and minimize errors in entering when the trend is opposite. Trendline only uses two points on the each trend, when the trend line is broken, then the trend line is invalid.
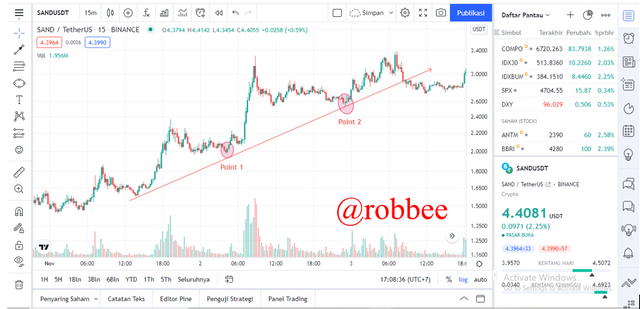
In an uptrend this trend line is useful as support when the candlestick touches the trend line it will bounce back, so it can take a position to enter until the trend line breakout occurs then the line is no longer valid. The following is an example of a trendline in an uptrend
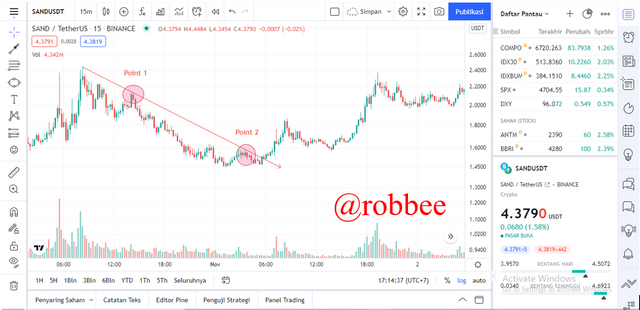
Not much different from the uptrend, the trendline in the downtrend is almost the same, only the difference lies in the function of the trend line, if in the downtrend the trendline serves as resistance when the candlestick touches the trendline, there will be a bounce, until the trendline is brakeout, the trendline is no longer valid. The following is an example of a trendline in a downtrend
3.)Explain trend continuation and how to spot them using market structure and trendlines. (Screenshot needed). Do this for both bullish and bearish trends.
When the market is moving in the direction of the trend that forms a zigzag on the candlestick chart, when the position is reflecting the direction can help traders to take positions when there is a bounce on the line that has been drawn.
Sometimes when there is a long trend, there is often a short correction to measure resistance in the trend whether the trend is valid to continue the trend or not valid to continue. Traders when following the direction of the trend, it is better to see when a bounce occurs whether it forms a long trend or there is a brakeout on the trend Here's how to see a continuation pattern in the market structure.
Structure Market
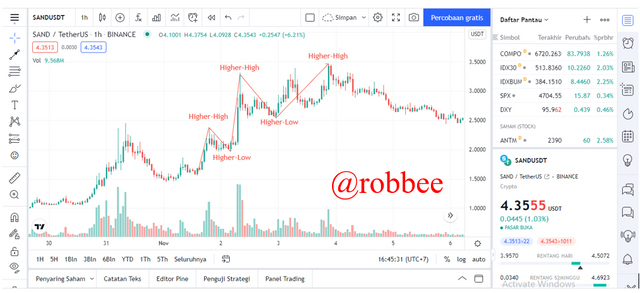
In this market structure, prices tend to form higher highs and higher lows in a bullish trend and in a bearish trend they form as lower highs and lower lows, when the candlestick chart is formed, there will be a continuous trend and can be a long trend to follow.
When a trend occurs like a bullish trend, at that time the buyers are in control of the market so that the sellers experience weakness, a bullish trend is formed by signaling higher highs and higher lows, at that time traders can take positions.
In the bullish trend to find out, the trend is happening by looking at the
-The previous high is lower than the most recent high.
-Its low must be lower than its latest low.
In the bearish trend, there are two things that must be considered when the trend is happening
-The previous low must be higher than the latest low
-The latest high while it is happening must be lower than the previous high
When a trend is happening, whether it's a bullish trend or a bearish trend when it doesn't match the concept, the trend is no longer valid to follow. Then there can be a change in direction so traders must follow the concept that has been made to follow the two trends.
Trendline
Trendline is a line drawn from two directions, from the highest to the lowest and vice versa. This trendline is useful as resistance when the trend is bearish and in the bullish trend the trendline serves as support. When the candlestick touches the line, a bounce will occur.
When the trendline brakes out, it can be said that the trend is no longer valid to follow, and can indicate that the trend is reversing.
4.)Pick up any crypto-asset chart and answer the following questions -
i) Is the market trending?
ii) What is the current market trend? (Use the chart to back up your answers).
i) Is the market trending?
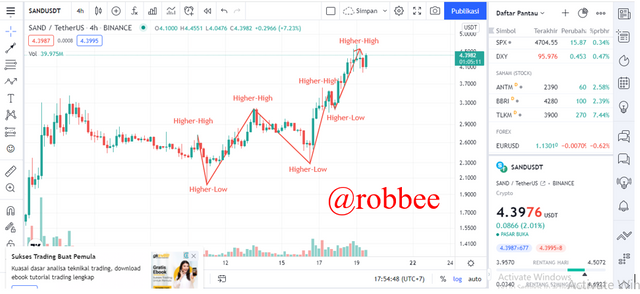
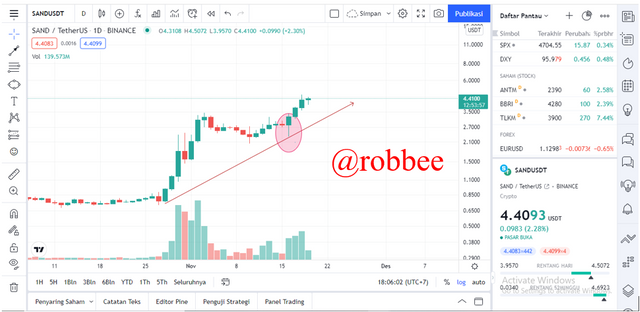
I will analyze the current trend in the SAND/USDT market on a 1-day to 4-hour timeframe. In the current market, the SAND/USDT market is experiencing a Bullish trend, as seen on the candlestick chart forming Higher-High and Higher-Low, there is a bounce in the price. 2.050 on a 1 day timeframe and forming a new Higher-Low.
It can be seen that the 4-hour timeframe has formed a new Higher-High, it is estimated that the trend will continue its bullish trend
ii) What is the current market trend? (Use the chart to back up your answers).
In the SAND/USDT market, it looks like it is experiencing a bullish trend on the 1-day timeframe, on the pull of the trendline there is also a bounce at the price of 2,314 so that the bullish trend continues, so traders can take positions if there is another bounce in the future.
Conclusion
To identify the market, we can use the market structure or trendline. To understand the trend that is happening, then we can use the market structure or trendline, by prioritizing the concepts that have been made.
The market structure and trendline are technical analysis in seeing the current trend and can also be a determining point in taking entry and exit positions, so as to minimize mistakes in making decisions.
this is a repost assignment from professor @reminiscence01.
this is the link from my original post:
https://steemit.com/hive-108451/@robbee/understanding-trends-crypto-academy-s5w1-homework-post-for-reminiscence01