Recognizing Simple Patterns in Trading - Crypto Academy / S5W2 - Homework Post for @sachin08
Hello steemian ...
This is my new post in the Steemit Crypto Academy community, on this season 5 week 2, I will be working on a homework from professor @sachin08 with the theme "Recognizing Simple Patterns in Trading”.

we will discuss it through the homework below:

1.) What is your understanding about Triangles in Trading. Explain all forms of triangles in your own words. (Screenshot required)
When trading we always use some analysis to help us to spot trends or get entry or sell signals. We can use indicator analysis, support and resistance analysis, pattern analysis, and others. Here I will discuss the analysis of patterns that occur on the market price chart. One pattern that can be used to perform the analysis is to use a triangle pattern.
The triangle pattern is usually used by traders to predict the next price up or down and also to predict the direction of the next trend. The key to using this triangle pattern is when we see a triangle pattern on the market price chart and the movement of the price chart is getting narrower in the triangle pattern that occurs, when there is a chart that breaks through the triangle pattern, it signals the formation of a new trend and gives us to take buying action. or sell.
3 types of triangle patterns can be found on market price charts, namely symmetrical triangles, ascending triangles, and descending triangles.
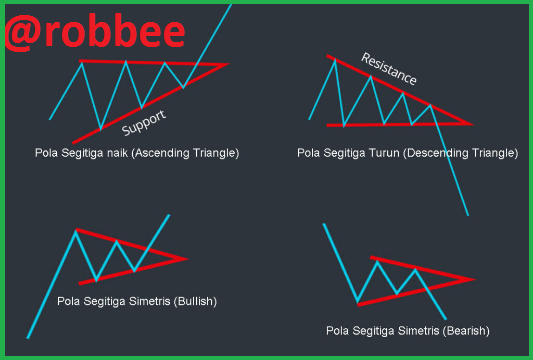
- Symmetrical Triangle
This symmetrical triangle pattern has the same shape as an equilateral triangle in mathematics, this symmetrical triangle pattern occurs when the high and low-level price charts form a slope when we draw a line following the high and low-level price charts and the ends meet, then the line forms asymmetrical or equilateral triangle then a symmetrical triangle pattern is formed. Slashes at high levels are usually referred to as resistance and slashes at low levels are referred to as support. So the concept of this triangle is not far from technical analysis of support and resistance.
In a triangle, there is a narrow part due to the meeting of two lines. When using this symmetrical triangle pattern, of course, the triangle pattern that initially widened will narrower, when the narrowing process occurs and there is a price chart that breaks through the symmetrical triangle pattern, this is a signal we are buying or selling and also a signal for the direction of the next trend. And here are two examples of a symmetrical triangle pattern.
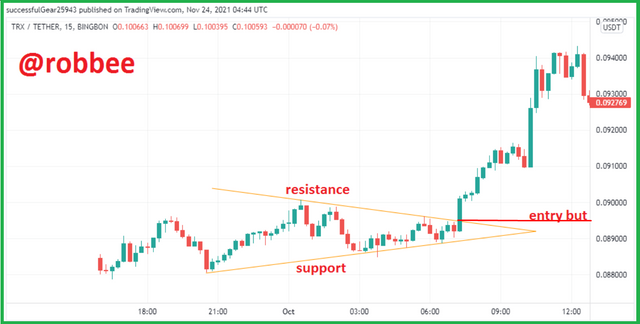
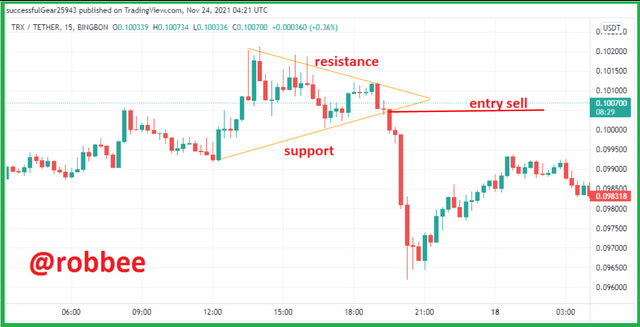
In the picture above, there are two conditions, the first condition is the chart breaks out at the resistance while the second condition the chart breaks out at the support. In the first picture, the chart breaks the resistance at $0.0895 and that is our signal for a buy entry. While in the second picture, the chart breaks the support at $0.1005 and is a signal for a sell entry.
- ascending triangles
The ascending triangle pattern has a shape resembling a right triangle in mathematics. An ascending triangle condition occurs when there is strong resistance and also the price chart is at a low level when a line is drawn it will tilt. Strong resistance means that the price chart will always bounce on the resistance section, which means the resistance line will be straight or horizontal while the support line will slope upward following the low-level price chart, and the ends of support and resistance will meet which will form an ascending triangle.
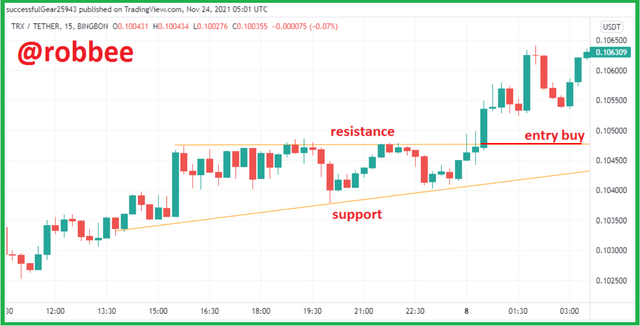
The picture above forms an ascending triangle pattern and the price chart breaks the resistance at $0.1048 and gives us a signal for a buy entry.
- descending triangles
The descending triangle has the same shape as the ascending triangle, but the descending triangle is the opposite of the ascending triangle. In the ascending triangle, the resistance is strong, while the price chart is at the low level, if the line is drawn, it will slant upwards. On the other hand, in the descending triangle, the descending triangle has strong support and resistance or high level when a line is drawn to form a downward sloping line.
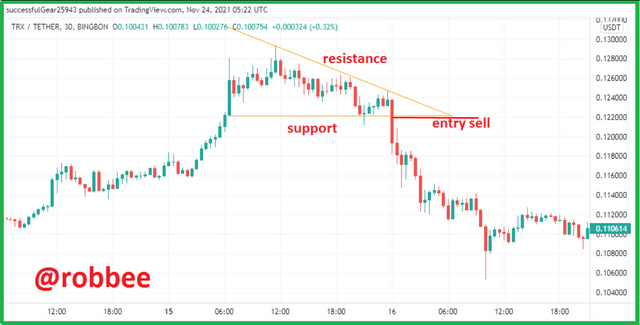
The picture above forms a descending triangle pattern and the price chart breaks the support at $0.12215 and gives us a signal for a sell entry.
2.) Can we also use some Indicators along with it Triangle Patterns? Explain with Screenshots.
Every time we do a market analysis, not necessarily the results we get will always be successful because it is humans who move market prices, which means market prices can change at any time. The main purpose of doing analysis is to find entry signals in the market that benefits us as a trader. We must also be aware of false signals in the analysis. When we only use triangle patterns in predicting trends or market prices, our percentage of getting false signals will be bigger. Using the help of indicators in conducting market analysis will strengthen the signal given by the triangle pattern, and here are examples:
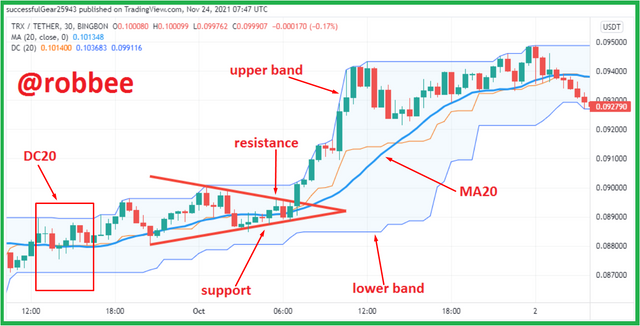
In the picture above, a symmetrical triangle pattern is formed, on 01 October 2021 at 07.00 WIB or 00.00 UTC the candlestick breakout resistance in the symmetrical triangle pattern indicates the trend will be bullish.
Here I use two indicators, namely moving average and Donchian channels. On the moving average indicator which has a blue line, I use the moving average setting of 20 (MA20). In the chart above the MA20 indicator also breaks out of the symmetrical triangle resistance line which is a signal for buy entry and also the price chart is above the MA20 indicator which indicates the trend is bullish, which means the moving average indicator has the same signal as the symmetrical triangle pattern.
The second indicator I use is donchian channels 20 (DC20). On the DC20 indicator, after the candlestick breaks out of the resistance of the symmetrical triangle pattern, then the candlestick touches the Upper Band of the DC20 indicator. After the candlestick touches the upper band on the DC20 indicator, the next candlestick still touches the upper band on the DC20 indicator which signals that the bullish trend that is happening is strong. The signal given by the DC20 is the same as the signal given by the MA20 and it is also a symmetrical triangle pattern which means that the signal given by the symmetrical triangle pattern is a real signal.
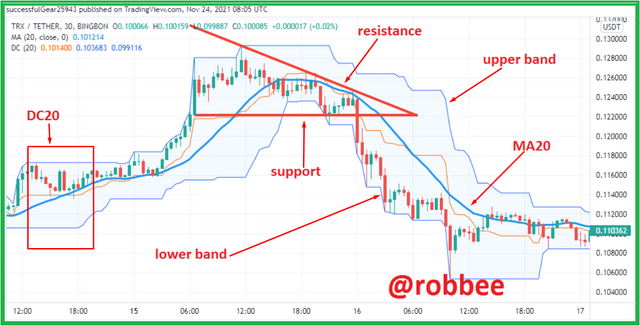
The picture above is an example of a bearish trend. Just like the previous one, the descending triangle pattern in the picture above gives a signal for a sell entry because the candlestick breakout on the support line of the descending triangle pattern indicates the trend will be bearish. In the example picture above, the MA20 and DC20 indicators also give the same signal as the signal given by the descending triangle pattern, which means the signal given by the descending triangle pattern is a real signal.
3.) Explain Flags in Trading in your own words and provide screenshots of both Bull Flag and Bear Flag.
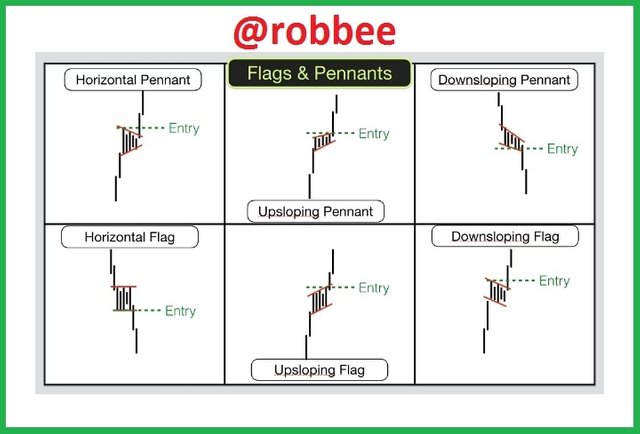
In addition to the triangle pattern, there is one other basic pattern that can be used in trading for profit. The pattern that can be used is the flag pattern, this flag pattern can be one of the chart patterns that are very easy to use and can also generate a lot of profit. This flag pattern has two conditions, namely a bull flag and a bear flag. This flag pattern can be said to be able to generate a lot of profit because this flag pattern often appears when market conditions are strong and if this flag pattern appears it indicates the direction of the trend will continue. This flag pattern is a chart continuation pattern and is widely used by traders around the world due to its ease of use and also provides great profits. This flag pattern is shaped like a flag in general, but some are combined with a triangular shape. Previously I said that there are two conditions for the flag pattern, namely the bull flag and the bear flag, here's an explanation.
- Bull flag
This bull flag is a pattern of flags that occurs when the market is in an uptrend. The shape is the same as the flag in general, namely, there is a pole and also the flag cloth itself. The formation of this bull flag pattern in the market starts from a strong upward price movement then continues by a slight decline that forms a channel with two lines, the two lines can form a triangle or a square. The two lines formed due to a slight decline are called support and resistance. When the chart inside both the support and resistance lines makes a breakout at the resistance section, it signals a signal for a buy entry, and also a bull flag pattern is formed.
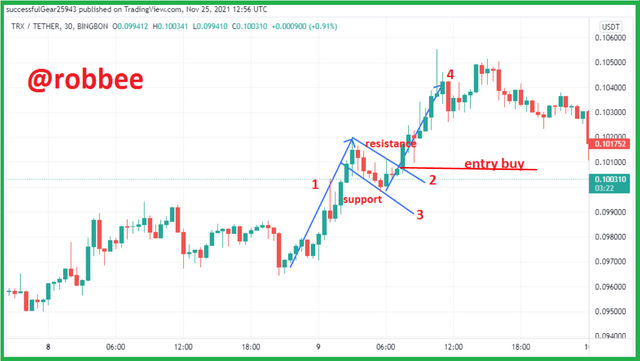
In the picture above is an example of a flag pattern. As explained earlier, this bull flag pattern starts from a strong uptrend and we can call it a flagpole and in the example above it lands on line number 1. After a strong trend, there is a slight decline and forms a channel with two support and resistance lines and we can name it the flag cloth, in the picture above resistance is coded with 2, and support is coded with 3. After the pole and flag cloth are formed, we have to wait for the price to breakout the resistance for entry buy and also give a signal that the trend will continue to rise, and also indicates that a bull flag pattern is formed.
- Bear flag
The bear flag is the opposite of the bull flag. If the bull flag occurs when market conditions are in an uptrend, this bear flag is formed when market conditions are in a downtrend. For the formation of the bear flag pattern, it is the same as in the bull flag, the only difference being that the bear flag is inverted. The following is an example of a bear flag in the market.
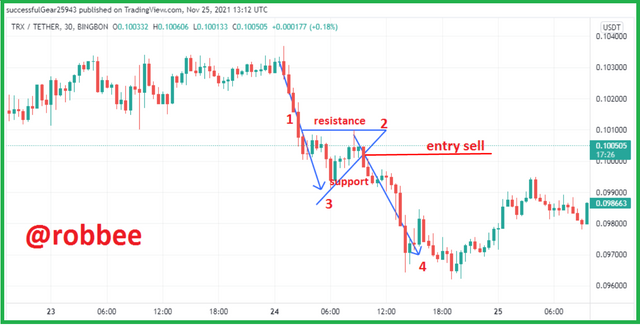
Just like in the bull flag, this bear flag starts with a strong trend decline which we call the flagpole, in the picture above it is on line 1. After the strong trend declines, there is a slight increase that forms a channel with two lines and can be referred to as flag cloth, the upper channel line is resistance and the lower channel line is named support, in the picture above resistance is coded with 2 and support is coded with 3. After the pole and flag cloth are formed we have to wait for a breakout at the support section, when the breakout happens indicates we have to enter sell, and also a bear flag pattern is formed.
4.) Show a full trade setup using these Patterns on any Cryptocurrency chart. (Ascending Triangle, Symmetrical Triangle, Bear Flag)
Every pattern we use in trading aims to make a profit, if we know how to form a pattern, then we also have to know what we should do when the pattern is formed. In this lesson, there are two basic patterns, namely triangles and flags, here are some settings that we can make to get an advantage in using triangles and flags.
- Triangle pattern
For the triangle pattern, I will give an example using a symmetrical triangle pattern.
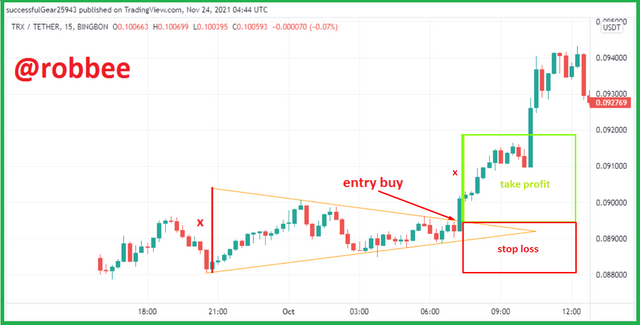
As shown above, a symmetrical triangle pattern has been formed. In the picture above the price chart breaks out of resistance which means a signal for a buy entry. When the price chart has broken out of the resistance, it is our signal to make a buy entry. The question arises, where should we place our take profit and stop-loss? We can place take profit along with the triangle tool and there I will mark it with x, for stop loss we can place it on the support section.
The picture above is a triangle in a bullish state, and the following is the placement of taking profit and stop-loss if the market is in a bearish condition.
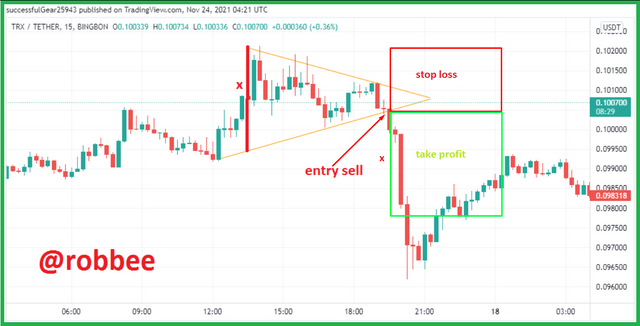
Just like the market condition is in a bullish state, because the example above occurs in a bear market condition, the action we will take is a sell entry action. Because market conditions are bearish, we can do sell entries when the price chart breaks out of support. To take profit, we can place it along the base of the triangle, in the picture above the triangle tool I will give a line with the code x. To stop loss, we can place it as far as resistance.
- flag pattern
For setting take profit and stop loss on this flag pattern, it is not much different from the triangle pattern, because the flag pattern has two conditions, namely a bull flag and a bear flag, so I will give an example of both.
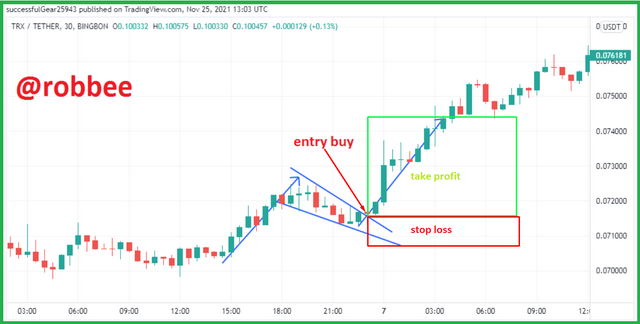
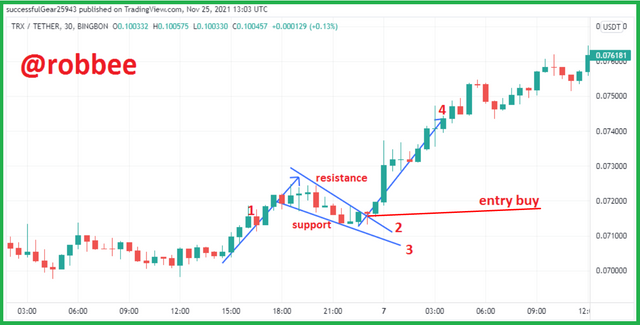
In the picture above is an example of a bull flag, when a bull flag is formed, we must enter a buy when the chart breaks out of resistance. We can place take profit on the flag pattern along with the flagpole that is formed as shown above. The stop loss can be placed parallel to the support.
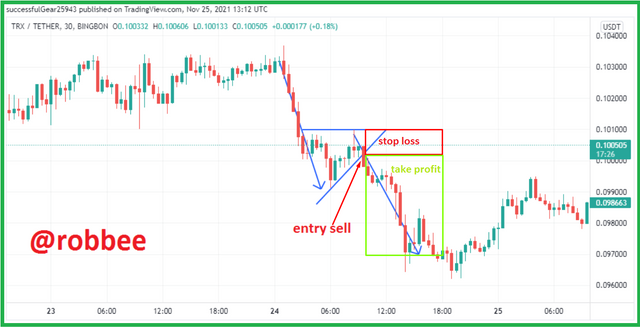
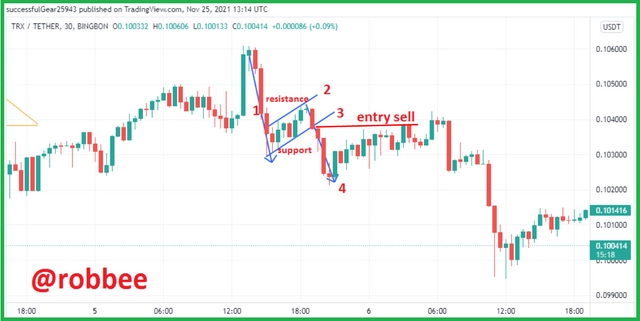
The picture above is an example of a bear flag, a bear flag occurs when market conditions are down like the picture above. When the flag pattern is formed, then there is a price chart that breaks out of the support, it is our signal for a sell entry. Take profit can be placed along with the flagpole as in the picture above. As for the stop loss can be placed parallel to the resistance.
5.) Conclusion.
Two basic patterns can be used to profit in trading, the pattern is the triangle pattern and also the flag pattern. Three triangle patterns can be used, namely the symmetrical triangle pattern, the ascending triangle, and the descending triangle. The flag pattern has two types, namely, bull flags and bear flags, bull flags occur when the trend is up while bear flags occur when the trend is down. Although the two patterns have different shapes, both patterns have a market entry time when the price chart breaks out of resistance or support.
References:
https://mikaylabinar.com/pola-segitiga-saham-triangle-untuk-membaca-pergerakan-market/
https://edukasi.javafx.co.id/article/pola-bullish-flag-bagaimana-cara-trading-pola-ini
https://www.google.com/amp/s/www.seputarforex.com/amp/artikel/trading-dengan-pola-segitiga-242911-31
https://www.google.com/amp/s/www.seputarforex.com/amp/artikel/pola-flag-probabilitas-tinggi-dan-mudah-dikenali-214091-31