“Perfect Entry” Strategy using Stochastic Oscillator + 200 Simple Moving Average - Crypto Academy / S5W3 - Homework post for @lenonmc21
Hello steemian ...
This is my new post in the Steemit Crypto Academy community, on this season 5 week 3, I will be working on a homework from professor @lenonmc21 with the theme "'Perfect Entry' Strategy using Stochastic Oscillator + 200 Simple Moving Average”.

we will discuss it through the homework below:

1.) State in your own words what you understand about the Perfect Entry Strategy (Place at least 2 examples on crypto assets)?
A perfect entry strategy is a strategy in trading to get the perfect entry signal. To use this perfect entry strategy requires us to combine several technical analyses in trading. The analytical technique used so that the perfect entry strategy can be obtained is using harmonic pattern analysis techniques, price action, and indicators. In my personal opinion, to get the perfect entry, you can use various methods, the point of which is that the entry signal given is a real signal, not a fake entry signal. To avoid these false signals, we should use some technical analysis to strengthen the truth of the entry signal given. The key to this strategy is to use the stochastic indicator and also the 200-period moving average (200 MA) and also assisted by harmonic pattern analysis and price action.
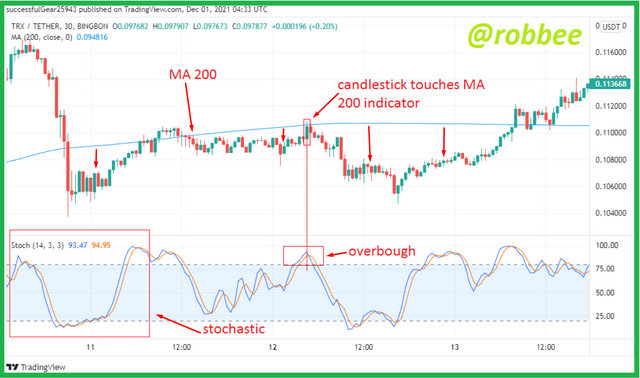
For the basis of the Perfect Entry, this strategy uses a combination of two stochastic oscillator indicators and the 200 MA. The main indicator we use in this strategy is the stochastic oscillator indicator, we all know how to use the stochastic indicator, in short, the stochastic indicator is divided into three zones, the lower zone starts from values 0 to 20, the middle zone from 20 to 80, and the upper zone from 80 to 100. The lower zone is an oversold signal which means a buy entry signal and the upper zone is overbought which means a sell entry, so the stochastic indicator is so easy to use, but the problem is whether the signal given is a real signal, of course, we can't guarantee it is a real signal, so we use the help of MA 200 to find out the signal is a perfect entry or a fake signal. The following is an example of using the stochastic and the 200 MA to get the perfect entry.

The picture above is an example of a perfect entry using the stochastic indicator and the 200 MA. As we can see that the stochastic indicator that I marked is in the zone below 20 which means the market is oversold and gives us a signal to buy entry. To strengthen this signal, we use the 200 MA indicator. In the picture above the trend is above the 200 MA indicator, when the stochastic indicator indicates the market is in an oversold state which means a buy entry signal, then the candlestick touches the 200 MA indicator, that is the signal from perfect entry and we take action for a buy entry, as we can see in the graph that the graph is going up.
The picture above is an example of a perfect entry in a clean state. In the picture above the trend is below the 200 MA indicator which means the trend is bearish, in the picture above the stochastic indicator enters the overbought zone which indicates a signal for sell entry, then the candlestick touches the 200 MA line, then it is a signal of perfect entry and we take action to entry sell.
2.) Explain in your own words what candlestick pattern we should expect to execute a market entry using the Perfect Entry Strategy.
As previously explained, to use the perfect entry strategy, several technical analyses are used. In addition to the indicator technique in the explanation in question no. 1, we also use harmonic technical analysis and also price action. The use of indicators in this perfect entry strategy is the last step or can be said as a closing step. The first step before using the indicator is to use the analysis of the harmonic patter technique and also price action.
The first step in carrying out this perfect entry strategy is to find out the dominant market trend at that time and also whether the trend is healthy, this step we can do using harmonic pattern analysis techniques. Many patterns can be used in harmonic patterns, here are some harmonic patterns that can be used.
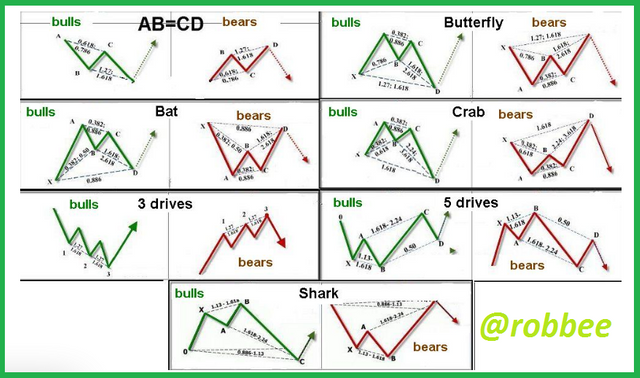
Harmonic patterns can be used to find out when a trend reversal will occur, for example when the chart is in a bullish trend, then a harmonic pattern is formed, then most likely the trend will turn to bearish. With the initial step using a harmonic pattern, we can find out the trend will reverse or the trend will continue.
The next step that can be used after knowing the direction of the trend is to look at the candlestick. Not all candlesticks can be used in the perfect entry strategy, the candlesticks used are candlestick rejection. This candlestick rejection has a candle body shape that is smaller than the wick. When this candlestick rejection appears, it indicates a trend reversal. This candlestick rejection is studied in price action technical analysis.
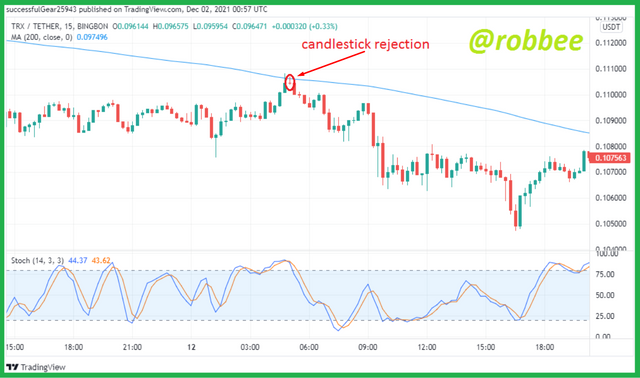
Like the picture above, when the candlestick touches the 200 MA indicator then the stochastic indicator enters the overbought zone, then next we have to look at the candlestick that is formed if the candlestick that is formed is candlestick rejection as in the picture above, then the perfect entry strategy can be used.
The next step after seeing the direction of the trend and also seeing the candlestick that is formed is to use both the stochastic indicator and the 200 MA. To complete the perfect entry strategy. For the use of the stochastic and MA 200 indicators, I explained earlier in question no 1. Here I will explain again.
As we can see in the picture above when the trend is above the 200 MA, then the 200 MA is supported, when the stochastic indicator enters the oversold zone which means a signal to buy, then we have to see if the candle touches or approaches the 200 MA indicator, if the candle touches or near the 200 MA, it indicates that the perfect entry strategy is ready to be used.
To use the perfect entry strategy, we have to see when the steps above are like looking at the direction of the trend, seeing the candle that is formed, and finally seeing the signal given by the stochastic indicator and the 200 MA, then the perfect entry strategy is formed and we have to enter the trade. If one of these 3 steps is not fulfilled then we should get out of the trade because the perfect entry strategy cannot be used.
3.) Explain the trading entry and exit criteria for buy and sell positions in any cryptocurrency of your choice (Share your own screenshots)
There are two conditions that we will get when using the perfect entry strategy, the first is a bullish condition and the second is a bearish condition, these two conditions have different entry methods. The following are criteria for buying and selling using the perfect entry strategy.
- Entry criteria
Previously I have explained the steps that must be taken in using the perfect entry strategy, the steps start from determining the trend using a harmonic pattern, after determining the trend the next step is to see if the candle rejection touches or is close to the 200 MA indicator, and the last step is to use the stochastic indicator and assisted by the MA 200 indicator.
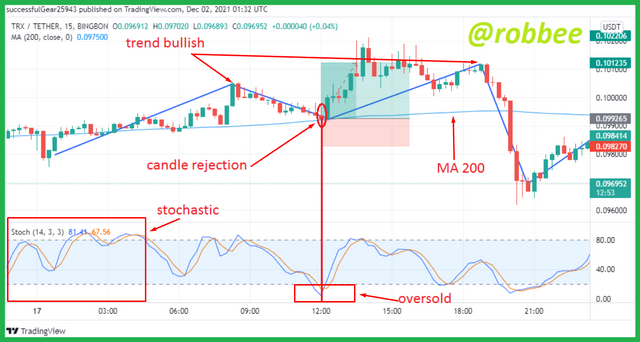
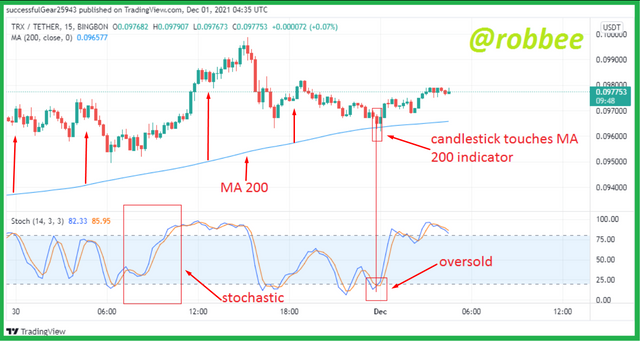
The picture above is included in the buying criteria in using the perfect entry strategy, the question is why the picture above can be said to be a perfect entry strategy? As I explained above, the first step in using the perfect entry strategy is to determine the trend, in the picture above the current trend is a bullish trend. The next step is to see the candle rejection touching or adjacent to the 200 MA indicator, in the picture above there is a candle rejection that touches the 200 MA indicator. The two steps to determine the trend and see the candle rejection have been fulfilled. The last step is to use the stochastic indicator, when using the stochastic indicator we only have to focus on the rejection candle that touches the 200 MA indicator, the chart on the stochastic indicator above shows that when the candle rejection is formed and we see the stochastic indicator enters the zone below 20 which means the market is in oversold conditions and is a buy entry signal.
Briefly, the picture above gives us 3 signals for buy entry, the first is a bullish trend, then in the bullish trend, there is a candle rejection when the chart goes down which means the chart will go up and it is a strengthening of the previous buy entry signal. Finally, by using the stochastic indicator we can further strengthen the buy entry signal because the candle rejection is an oversold zone on the stochastic indicator, therefore a perfect entry strategy is formed because the trend is above the 200 MA indicator and also the trend is bullish, so our action is entry buy.
For a buy entry, it can be done on the next candle after the rejection candle. In the example above, it is a TRX/USDT coin, we can enter for $0.099265, we can take profit using a 2:1 ratio, which means we can place a take profit at 2% and a stop loss at 1%. In the example image above we can place a take profit at $0.1101235 and place a stop loss at $0.098270.
- Selling Criteria
The steps in knowing the selling criteria in the perfect entry strategy are the same as in the buy criteria, and here are examples.
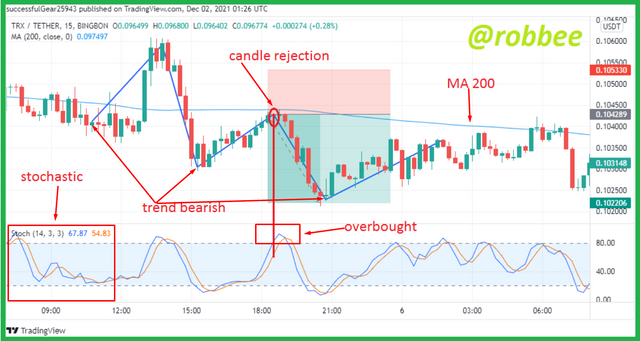
The first step is to determine the trend, in the example picture above the trend that is formed is a bearish trend, meaning that the bearish trend is a selling criterion. The next step is to see if the candle rejection touches or approaches the MA 200 indicator, in the example picture above there is a candle rejection that touches the MA 200 indicator, but the candle rejection in the example image above touches the MA 200 indicator from below the MA 200 indicator which indicates the selling criteria. The final step is to look at the stochastic indicator when the rejection candle is formed and when we look at the rejection indicator, the chart is above 80, which means the market is overbought and is a signal to sell. Because when the move has been formed and it's time to give a signal for a sell entry, the perfect entry strategy in the selling criteria is formed.
We can immediately enter sell on the next candle, which is for $0.104289. Just like in the buy criteria, we can use a 2:1 ratio to get a profit, there is a take profit when they sell entry is below and the stop loss is above. Then we can place a take profit at $0.102206 and place a stop loss at $0.105330.
Practice (Remember to use your own images and put your username)
Trade 2 demo account trades using the "Perfect Entry" strategy for both a "Bull" and "Bear" scenario. Please use a shorter period of time to execute your entries. Important you must run your entries in a demo account to be properly evaluated.
- Bullish
To complete this task I use a platform that uses my country's currency, namely Indonesia. The platform is Upbit. Here I use XLM/IDR coins. Here are the results of the perfect entry strategy that I used in real trading.
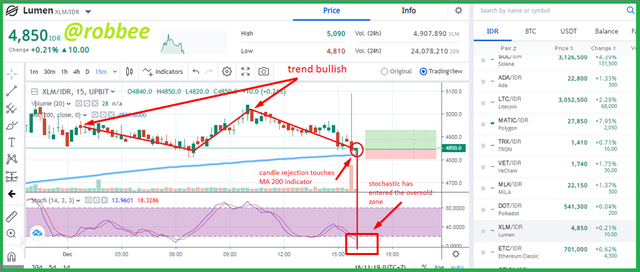
In the picture above I made a purchase of XLM/IDR coins on December 1, 2021, at 16:11 WIB or 9:11 UTC for 4.850 IDR or $ 0.3364. Here I use the perfect entry strategy on a 15-minute time frame with buy criteria before making a purchase. My first step is to see the direction of the current trend, in the picture above the bullish trend is happening, the bullish trend is the criteria for a buy entry. After I found out the bullish trend was in progress, then I saw the formation of candle rejection after a chart decline, which means the chart will rise again, one of the entry buy criteria is the presence of candle rejection in the bullish trend that touches or is close to the 200 MA, in the picture above the candle rejection is in a bullish trend and also the rejection candle touches the MA 200 indicator. The last buy entry criterion is the stochastic indicator is below the value 20 which means it is oversold, in the picture above the three buy entry criteria are met, so I immediately took action for entry buy. I put a 2:1 ratio for profit.
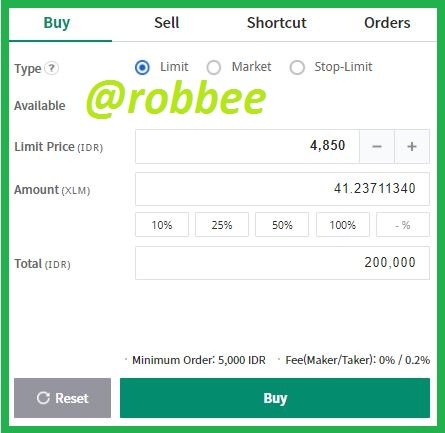
Here I purchased 200,000 IDR or $13,9002. Then I will get 41.23711340 XLM/IDR coins. As I explained above, I use a 2:1 ratio to make a profit, which means I place a take profit for 4.947 IDR or $0.344 which is 2% of the purchase price, then I place a stop loss for 4801.5 IDR or $0.3339 which is 1% of the price. purchase price.
- Bearish
For this bearish scenario, I use the same platform as the bullish scenario, namely the Upbit platform. Here I use ONT/IDR coins.
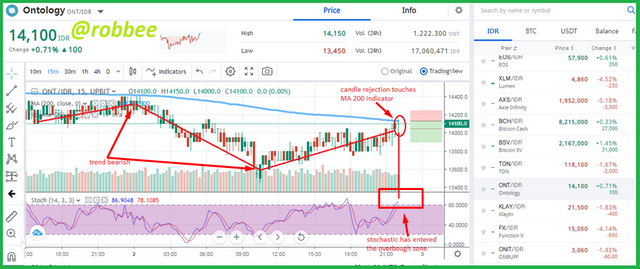
In the picture above I sold ONT/IDR coins on December 2, 2021, at 22:05 WIB or 15:05 UTC for 14,100 IDR or $0.9769, before making the sale I had purchased ONI/IDR coins first. Here I use the perfect entry strategy on a 15-minute time frame with selling criteria before making a sale. In the first step, I saw the direction of the current trend, in the picture above the bearish trend is happening, the bearish trend is the criteria for a sell entry. After I found out the bearish trend was in progress, then I saw the formation of candle rejection after the graph increases which means the graph will go down again, one of the sell entry criteria is the presence of candle rejection in the bearish trend that touches or is close to the 200 MA, in the picture above the candle rejection is in a bearish trend and also the rejection candle touches the 200 MA indicator. The last sell entry criterion is the stochastic indicator is above 80 which means it is overbought, in the picture above the three sell entry criteria are met, so I immediately took action for sell entry. I put a 2:1 ratio for profit.
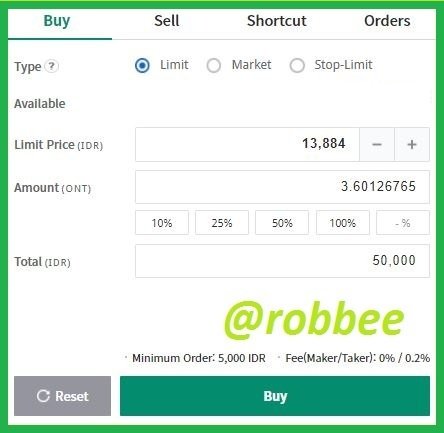
Here I enter sell at the coin price of 14.100 IDR or $0.9769. before I made a sale, I had already purchased 50,000 IDR or $3.4641 ONT/IDR coins at the 13.844 IDR or $0.9591 coin price, and I have 3.61167293 ONT.
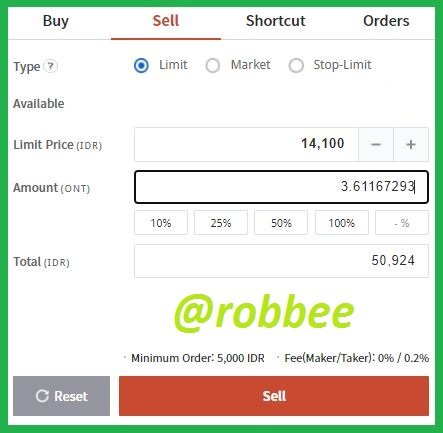
That's why I sold all my ONT coins at 14,100 IDR or $0.9769. So I have a profit of 924 IDR or $0.0640. After I enter a sell entry at the ONT coin price of 14.100 IDR or $0.9769, I use a 2:1 profit to make a profit, then I place a take profit at the price of 13.818 IDR or $0.9573 which is 2% of the sell entry, then I place a stop loss at the price 14,241 IDR or $0.9866 which is 1% of sell entry.
Conclusion
This perfect entry strategy is a strategy when trading, of course, this strategy is used for profit, this strategy uses some combination of trading technique analysis. To use this perfect entry strategy, we must know in advance about the trend or harmonics, price action, and also stochastic indicator. If you already know about the technical analysis, it will be easy to use the perfect entry strategy. To use this perfect entry strategy, first, we have to know the trend that is happening, then look for candle rejection in the trend that is approaching or touching the 200 MA indicator, next is to see whether the market is overbought or oversold using the stochastic indicator. We can use a 2:1 comparison in making a buy entry or a sell entry in using the perfect entry strategy.
References:
https://id.upbit.com/home
https://www.pelatihanprofitinternasional.com/edukasi-harmonic-pattern-untuk-trading-forex/
https://www.tradingview.com/chart/ITAaNOcQ/
Muy buenas gráficas amigos, son muy claras en información
Thank you friend