Introduction to the Principles of Crypto Analysis - Crypto Academy S4W7 - Homework Post for @imagen
Hello steemian ...
This is my new post in the Steemit Crypto Academy community, on this season 4 week 7, I will be working on a homework from professor @imagen with the theme "Introduction to the Principles of Crypto Analysis”.
we will discuss it through the homework below:
1.) What is the difference between Fundamental Analysis and Technical Analysis? Which one is used most often?
Fundamental Analysis
Fundamental analysis is an analysis whose method is based on the price and financial statements of an asset, more broadly matters relating to projects and the fate of an asset in the future. Fundamental analysis is often used by investors for long-term investments. In the fundamental analysis on cryptocurrencies, the analysts usually aim to obtain information such as the coin's rating, the total market cap of the coin, the development team of the coin, the investors supporting the coin developing company, and a clear roadmap for future projects.
For now, Fundamental Analysis can be easily done on the website https://coinmarketcap.com/, whatever coin you want to do the fundamental analysis you can find here.
technical analysis
Technical analysis is an analysis whose method is based on observing the price movement of an asset, trading volume, and also the direction of the trend that will occur. Especially for cryptocurrency users whose price changes are very volatile. The observations made are very dependent on the help of charts and how to read patterns and the help of indicators on the chart so that investors will get information when to buy and sell with the maximum profit.
For now, Technical Analysis can be easily performed on the trading platform. In addition, for more complete features, Technical Analysis can be done on the website https://www.tradingview.com/. On the website you can find many assets that technical analysis can do, then the indicators provided are also very complete.
Which one is used most often?
Technical analysis and fundamental analysis, are often used. However, both are used based on the period investors will use them. If an investor wants to invest long-term, then he is better off using fundamental analysis. whereas if a short-term investor or we often call a trader, then he is better off using technical analysis. This is because the use of fundamental analysis is more of a clear future project roadmap so that investors will be patient waiting for future results. While technical analysis refers to the price per hour, daily or weekly so that the price movement refers to investors always analyzing their movements and taking profits in the short term.
When viewed today, most investors play in the short term so that technical analysis is more often used while fundamental analysis is mostly used by people who have large funds for investment and they only have a few.
2.) Select one of the following crypto assets and perform a Fundamental Analysis showing the Project objectives, Financial Metrics and On-Chain Metrics.
Cardano (ADA)
Solana (SOL)
Terra (MOON)
Chiliz (CHZ)
Polka dots (DOT)
In this question I will be doing a Fundamental Analysis showing Project objectives, Financial Metrics and On-Chain Metrics on the Cardano (ADA) crypto asset.
Project Goal
Cardano was founded by a mathematician Charles Hoskinson and is also the Director of the Bitcoin Education Project and the founder of the Bitcoin Foundation and the co-founder of Ethereum. In its development, Cardano is supported by 3 companies, namely The Cardano Foundation, Input Output Hongkong (IOHK) and Emurgo.
The aim of cardano is to bring banking systems that collaborate with blockchain technology to be accessible in developing countries. Unlike Bitcoin, which aims to take over the entire financial system. Cardano is also a platform that aims to improve security with smart contract features.
Cardano roadmap is a summary of Cardano's development, which has been organized into five eras: Byron, Shelley, Goguen, Basho, and Voltaire. Each era is centered around a set of functionality that will ship across multiple code releases. The cardano roadmap describes a summary of the development of cardano. Cardano has been set in 5 eras, namely Byron era, Shelley era, Goguen era, Basho era and Voltaire era. Each era will be carried out with the development of various aspects based on research and prototyping.
Financial Metrics
In financial metrics, the information needed is related to market capitalization, liquidity and volume as well as supply mechanisms. The data can be found on the website https://coinmarketcap.com/ and the discussion is as follows:
Based on a screenshot of the crypto asset Cardano (ADA) taken at 7:58 UTC, the current price is $2.13, the low for 24 hours is $2.11 and the high is $2.16. market capitalization of the crypto asset Cardano (ADA) is $70,201,323,486. Then for a fully diluted market cap of $96,022,756,073. volume in the last 24 hours was $2,836,653,600. The volume/market cap is 0.04039. In terms of supply mechanism, currently the total supply is 33,250,650,235 ADA from a maximum supply of 45,000,000,000 ADA, meaning that currently the supply of ADA coins that have been circulating is 73%.
On-Chain Metrics
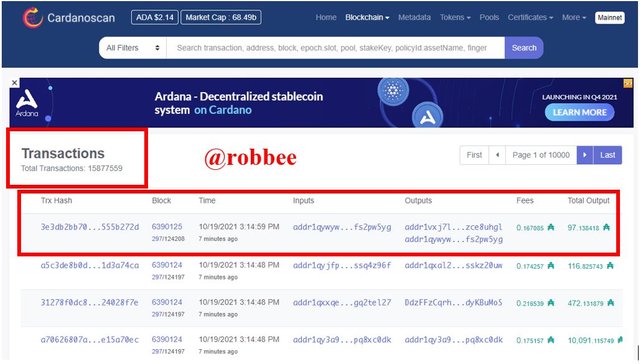
In On-Chain Metrics, the required information is related to Transaction Count, transaction value, active address, fees paid and transaction hash. The data can be found on the website https://cardanoscan.io/ and the discussion is as follows:
Based on the screenshot taken at 8.23 UTC, Transaction Count currently stands at a total of 15,877,559 transactions.
transaction value is 97.138418 ADA ($206.90), fee paid is 0.167085 ADA ($0.35). the last block is block #6390125 with transaction hash which is 3e3db2bb702c26f91a1e46bffa62cbb3ac5b19f94cd14f0243975a84555b272d. and there are also sender and recipient transaction addresses below:
3.) Make purchases from your verified account at least 10 USD of the currency selected in the previous point. Explain the process. (Show Screenshot).
In this question, I will be purchasing Cardano assets using the Upbit exchange platform.
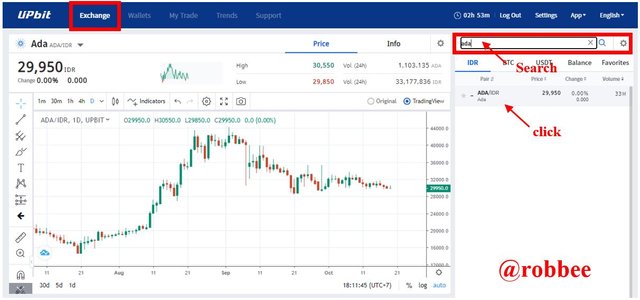
In the first step, make sure you go to upbit and select the exchange menu. Then in the search menu, look for the EXIST asset. Because my currency is IDR, so I am looking for ADA/IDR assets. It can be seen that currently ADA/IDR is for 29,950 IDR. In general, ADA is in a downtrend, but in general, ADA is still in a sideways condition.
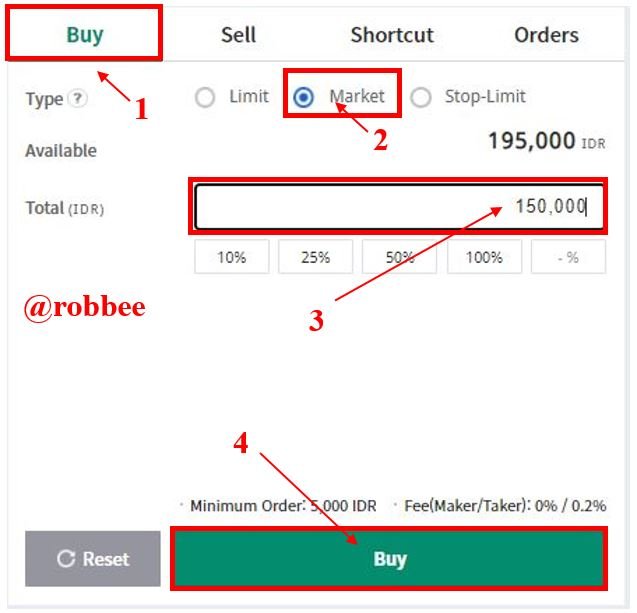
Then scroll down, in the buy menu select the market option. Then enter the value of your purchase, here I bought ADA assets for 150,000 IDR (10.64 USD). Then purchase by pressing buy.
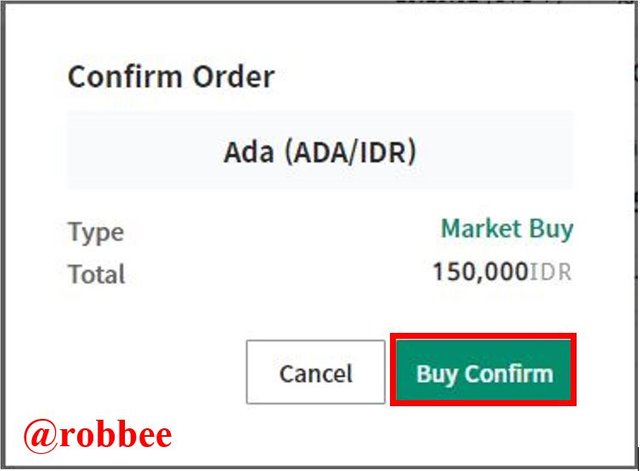
Then the order confirmation screen will appear, then press confirm and the purchase is complete.
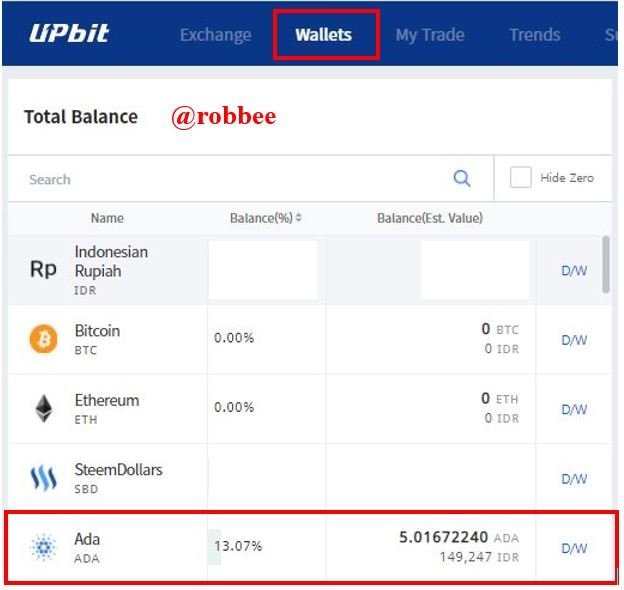
To make sure the order has been entered or not, go to the wallet menu and check. In my wallet, assets exist confirmed and I have 5,01672240 ADA.
4.) Apply Fibonacci retracements to a pre-selected asset with a time frame of 4 hours on the platform of your choice. Observe price developments in 24 and 48 hours, is it increasing or decreasing in value? Look to identify resistance and support levels. (Show Screenshots at 0, 24, and 48 hours of purchase where date and time are observed).
0 HOURS screenshot
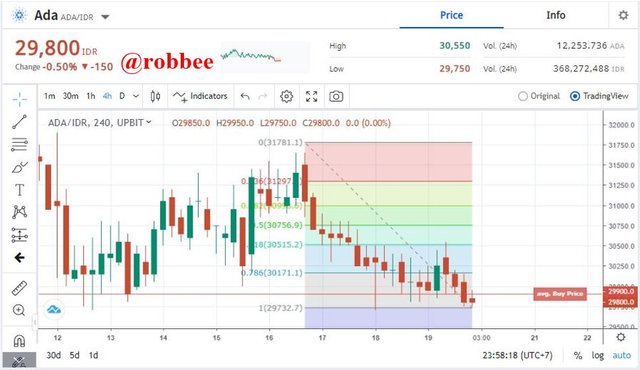
It can be seen below, that I took a screenshot of 0 hours on 10/19/2021 at 23:58 UTC+7. I purchased an ADA/IDR asset when the price was 29,800 IDR. Then, we can also identify the trend is in a downturn so that based on the Fibonacci principle that if it is in a downtrend, the resistance levels are at the levels of 23.6%, 38.2%, and 61.8%.
However, I forgot to take data to identify support at 0 hours, so I only took it at 24 hours. However, support levels can still be identified, namely at the levels of 161.8%, 261.8%, and 423.6%.
24 HOURS screenshot
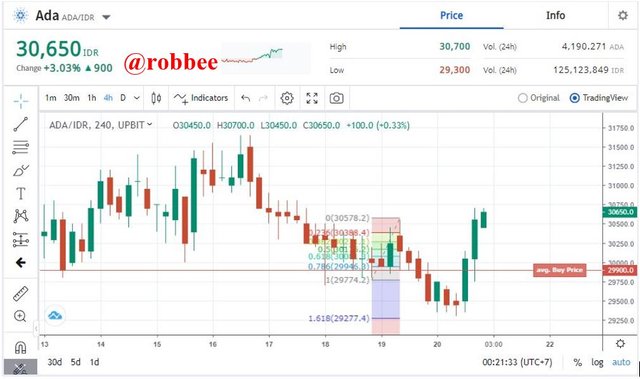
It can be seen below, that I took a 24-hour screenshot on 10/21/2021 at 00.05 UTC+7. Currently, the ADA/IDR asset has risen to the price of 30,650 IDR. Then, we can also identify an uptrend so that based on the Fibonacci principle that if it is in an uptrend, the support levels are at 23.6%, 38.2%, and 61.8%.
However, the resistance level has not been identified because the movement is still in the same direction and there is no resistance to the price movement so that the Fibonacci line cannot be drawn or taken.
48 HOURS screenshot
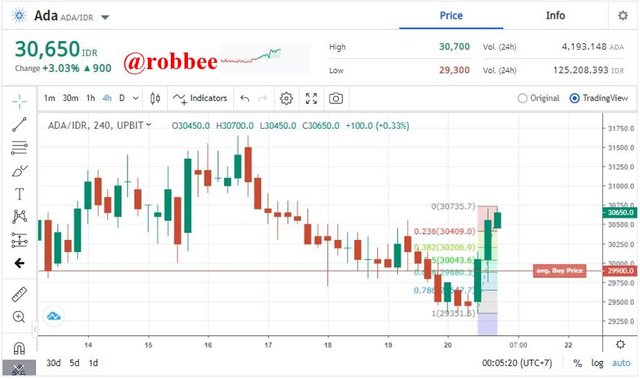
It can be seen below, that I took a 48-hour screenshot on 10/21/2021 at 23:57 UTC+7. Currently, the ADA/IDR asset has dropped to 30,650 IDR. Then, we can also identify the trend is in a downturn so that based on the Fibonacci principle that if it is in a downtrend, the resistance levels are at the levels of 23.6%, 38.2%, and 61.8%.
However, it has not been able to identify the support level because the movement is still in the same direction and there is no resistance to the price movement so that the Fibonacci line cannot be drawn or taken.
5.) What are Bollinger Bands? How do they apply to Crypto Technical Analysis? With which other tool or indicator do you combine Bollinger Bands to analyze Crypto? Justify your answer.
What are Bollinger Bands?
Bollinger band is an indicator created by John Bollinger in 1980 which has a function as a technical indicator to determine the direction of market trends and a measure of volatility. On the Bollinger Bands indicator, there is a Simple Moving Average (SMA) which is squeezed by two bands, namely the upper band and the lower band. The upper band is called the Upper Bollinger Band while the lower band is called the lower Bollinger Band.
The upper and lower bands can change following the increase or decrease in the value of the Simple Moving Average (SMA) based on how the standard deviation works, where the standard deviation measures how much volatility the price can move from the price it should have, meaning that the upper and lower bands can change. follow market conditions.
How do they apply to Crypto Technical Analysis?
Following the recommendation of John Bollinger, that the best use is the 20-day moving average. In this setting, it is recommended to use 2 standard deviations based on the 20-day moving average. This setting will later make the distance between the Upper and lower bands further apart so that it shows a very clear trend, so it will be very easy to draw to identify it.
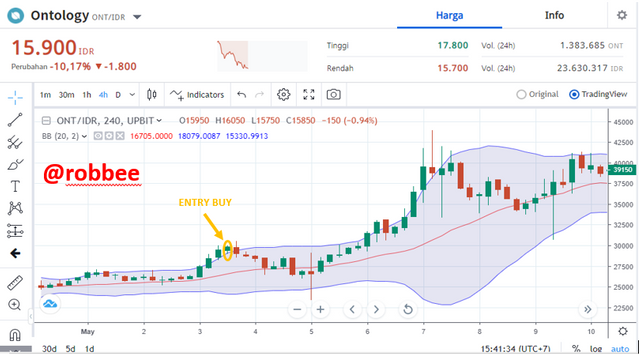
An example of using a Bollinger band in an uptrend, when the price breaks the upper band and the closing price is outside the band. while in a downtrend, when the price breaks through the lower band and closes outside the band. We can do a buy entry when the price or bar formation has completely exited the upper band. Here's an example:
From the coin ontology chart, we made a purchase or entry buy on May 3, 2021, at a coin price of 30073 IDR, because at that time the bar formation was completely out of the upper band.
With which other tool or indicator do you combine Bollinger Bands to analyze Crypto?
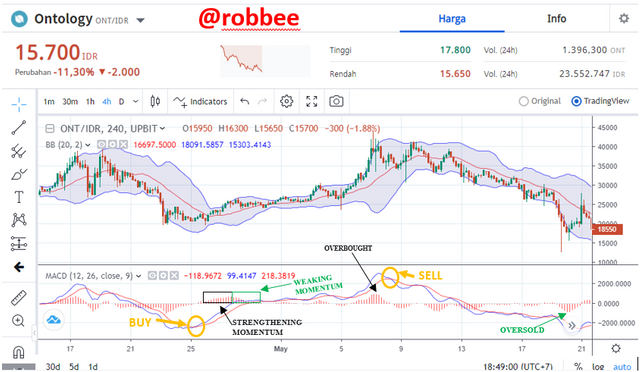
In my opinion, the best indicator to use with Bollinger bands is the MACD indicator. Because MACD has excellent clarity in showing market conditions based on the direction of the trend and its momentum. So that we will get very clear information about when is the best time to enter and get the best information about the best time to buy and sell. I will give an example as follows:
at this stage I use the chart from the coin ontology, I use the basic MACD settings (12,26,9). As I said earlier, using MACD will show the direction of the trend based on its momentum. An example of strengthening momentum is from April 25 to 27, it can be seen from the histogram that moves from short to long. Meanwhile, the momentum weakened, namely in the middle of April 27, it can be seen from the histogram which started from long to continue to shorten. Then you can see the best time to buy, which is when the EMA-12 and EMA-26 cross each other from the bottom up. while the best time to sell is when the EMA-12 and EMA-26 cross each other from top to bottom.
Even to know the state of overbought and oversold, just by looking at the top of the MACD area. For overbought, the peak of the MACD area is in the positive area, while for oversold, the peak of the MACD area is in the negative area. Using the MACD indicator with Bollinger bands is very easy to read the chart.
6.) Conclusion
In analyzing crypto assets and any assets, as an investor or trader, you must first analyze them. The analysis carried out may be in the form of fundamental analysis and may also be in the form of technical analysis, depending on which trading style you use. If an investor wants to invest long-term, then he is better off using fundamental analysis. whereas if a short-term investor or we often call a trader, then he is better off using technical analysis. Avoid buying without doing an analysis, because it makes you like gambling and can make you experience losses.
Reference
https://coinmarketcap.com/
https://www.tradingview.com/
https://cardano.org/
https://blog.pluang.com/cerdascuan/investasi/crypto/analisis-fundamental-aset-kripto/
https://cardanoscan.io/







Gracias por participar en la Cuarta Temporada de la Steemit Crypto Academy.
Continua esforzandote, espero seguir corrigiendo tus asignaciones.