[ Crypto Trading by Identifying Support and Resistance ]-Steemit Crypto Academy | S6W3 | Homework Post for @shemul21
Hello steemian ...
This is my new post in the Steemit Crypto Academy community, on this season 6 week 3, I will be working on a homework from professor @shemul21 with the theme "Crypto Trading by Identifying Support and Resistance”.

we will discuss it through the homework below:

1.) What is the Support & Resistance zone?
Support and resistance are the basis for technical analysis. Support and resistance are two things that cannot be separated, for the position of support is always under resistance. Support is an area that is formed when the price chart has stopped falling and starts to rise again, when this happens we can create support in that area. While resistance is an area that is formed when the price chart has stopped rising and started to fall, when that happens we can create a resistance level in that area. We can draw support and resistance areas as a line or draw with a zone. For more details, see the example below.


As can be seen in the image above, we can create support and resistance areas with two lines or we can draw them with an area. Both forms do not affect how support and resistance work. The thing to remember is that the support area will not always be a support area, under certain conditions the support area can turn into a resistance area and vice versa with the resistance area.
It is very easy to create support and resistance areas. To create a support area, we only need to look at the chart going down then when the chart can't continue its decline again and starts to rise then that area is a support area. For the resistance area, we only need to see the chart rising then the chart can't continue to rise and starts to decline, this area is a resistance area. For more details, see the image below.

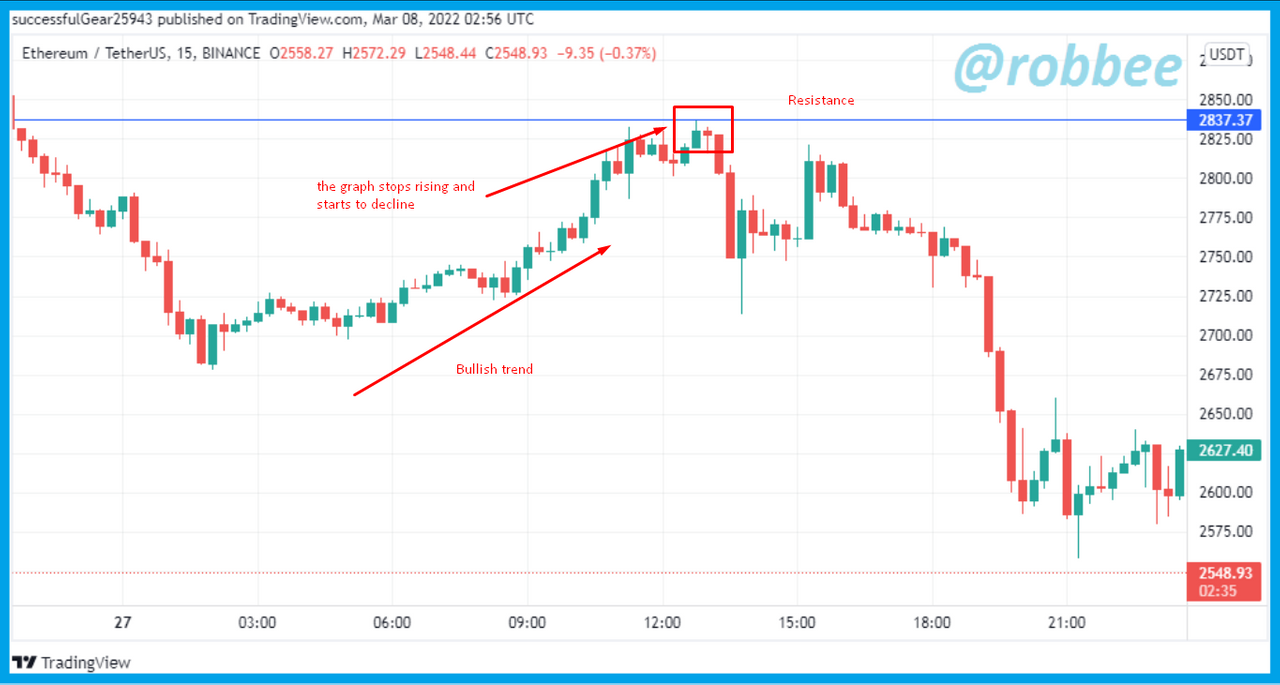
Support and resistance are usually used by traders to analyze the next market price movement, when the graph breaks the resistance, it indicates the graph will increase, when the graph breaks the support, it indicates the graph will decrease. This is used by traders as a signal to enter the market. when support and resistance have been formed traders just wait for the chart to break through support or resistance to start entering the market.
2.) Explain different types of Support & resistance with proper demonstration.
Support and resistance do not always have the form of a horizontal line or horizontal zone as in example number 1. There are several other types of support and resistance that can be used by traders. For more details, I will explain several types of support and resistance that can be used by traders.
1. Support and Resistance horizontally.
The first type of support and resistance is horizontal. This type is very common and is widely used by traders to find out the next market price. To make support and resistance with this horizontal form I have explained it in number 1, but some shortcomings need to be added. To create a support area we only need to look at the chart going down then when the chart can't continue its decline again and starts to rise then that area is a support area. For the resistance area, we only need to see the chart rising then the chart can't continue to rise and starts to decline, this area is a resistance area. Another addition is that the support and resistance areas that we created must experience several price chart reflections, for more details, see the image below.

As you can see in the picture above, I have created support and resistance areas using a line. When I have created the support and resistance areas, we can see that the chart has experienced several price bounces at the support and resistance areas.
When support and resistance have been formed, then we only need to wait for the chart to break out of support or resistance to find out the next market price movement. If the chart breaks out of the resistance then the next price movement will go up, otherwise, if the chart breaks out on the support then the next price movement will decrease. In number 1 I said that the support area will not forever be a support area and the resistance area will not forever be a resistance area. The support area can turn into a resistance area if the chart breaks out of the support area and the resistance area can turn into a support area when the price chart breaks out in the resistance area. For more details, see the image below.

As we can see in the picture above, I have formed support and resistance areas. When the chart breaks out of the support as in the example above, then the support area will turn into a resistance area, as well as when the chart breaks out of the resistance area as in the example above, the resistance area will turn into a support area.
2. Support and resistance with trendline
The second type of support and resistance uses a trendline. There are two types of trends in the market, namely an uptrend and a downtrend. When the trend is up, we have to make a trendline below the chart to anticipate a decline in the chart, the trendline will become a support area, while when the trend is down, we make a trendline above the chart to anticipate a trend change, the trendline becomes a resistance area. The conclusion that can be drawn from the explanation above is that when the trend is up, we can create a support area and when the chart is down, we can create a resistance area, for more details can be seen in the image below.

The example above is a chart in an uptrend, an uptrend is formed when the chart's new high is higher than the previous high and the new low is higher than the previous low. When the uptrend is formed, then we create a support area so that we know when the chart trend will reverse. When the chart breaks out of the support area as in the example above, we can see that the chart will experience a downtrend.

The example above is a chart in a downtrend, a downtrend is formed when the chart's new high is lower than the previous high and the new low is lower than the previous low. When a downtrend has been formed, then we create a resistance area so that we know when the chart trend will reverse. When the chart breaks out of the resistance area as in the example above, we can see that the chart will experience an uptrend.
In addition, we can combine both types of horizontal and trendline support and resistance to form a new strategy, the triangle strategy.
3. Dynamic Support and Resistance
For the third type of support and resistance, we can use the help of moving average indicators. For how to use it the same as other types of support and resistance. Many traders use this type of dynamic support and resistance using moving average indicators with 3 periods at once, most traders use 20, 50, and 200 periods. When the moving average periods have different meanings, when the chart touches the 20 periods moving average This means that the market is in a healthy trend, when the chart touches the 50-period moving average, the market most likely needs a break, while when the price chart hits the 200-period moving average, it means that there will be a trend reversal.
To determine the area of support and resistance using the moving average indicator can be seen in the image below.

In the picture above, we can see that the moving average indicator is below the price chart, meaning that the moving average indicator is a support area
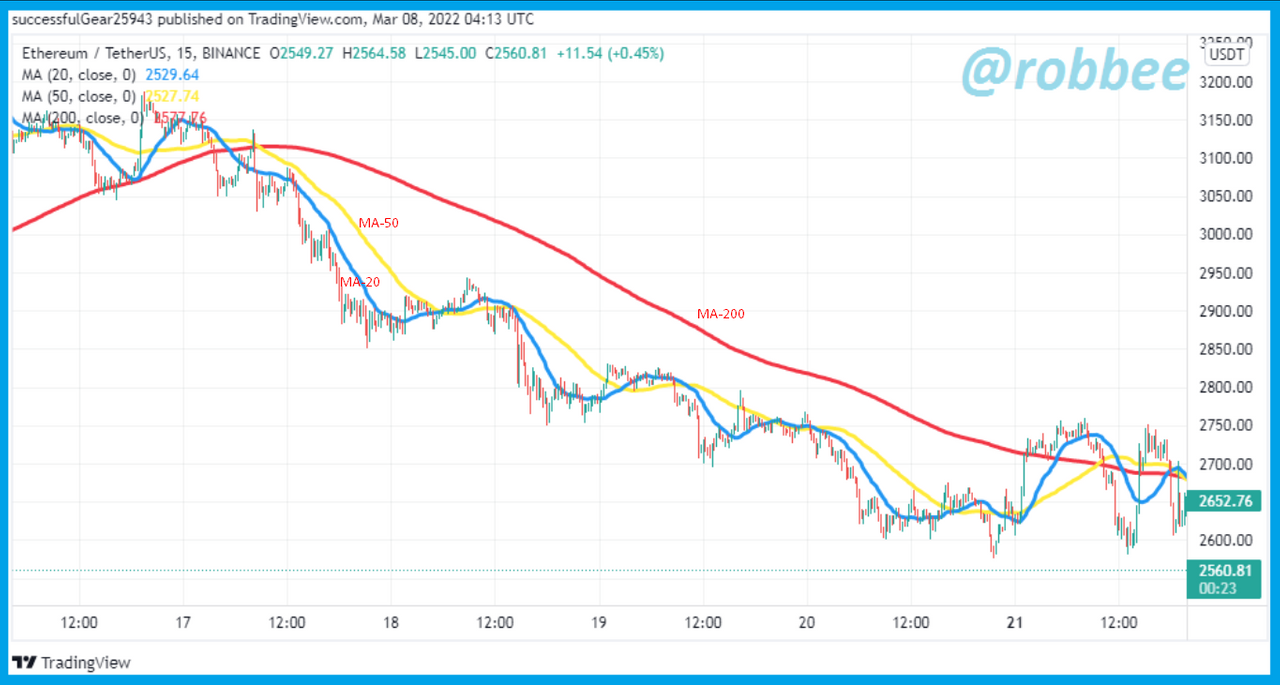
In the picture above, we can see that the moving average indicator is above the price chart, which means the moving average indicator will become an area of resistance.
4. Multi-Timeframe Support and Resistance
The fourth type of support and resistance requires us to use more than one timeframe in the formation of support and resistance. Here we will use three types of timeframes, namely long-term timeframes, medium-term timeframes, and short-term timeframes. When the timeframe has different support and resistance zones. Long-term timeframes will be the primary zone, medium-term timeframes will be secondary zones and short-term timeframes will be minor zones.
After we know the three support and resistance zones above, we have to know the function of these zones. The main zone will give us price information that is difficult for the price chart to penetrate because this main zone is on a long-term timeframe for example we use the 1-hour timeframe. We use the secondary zone to find out the market structure that occurs, because this secondary zone uses a medium-term timeframe, we can take the example of a 30-minute timeframe. We can use a small zone as a confirmation to make a trade, because a small zone uses a short-term timeframe, we can use a 5-minute timeframe. For more details, see the example below.

As can be seen in the picture above, the main zone formed on the 1-hour timeframe is at 3040.82 USDT, which means the price will be difficult to penetrate at that price. Then the secondary zones formed on the 30-minute timeframe provide information that the market structure is in a downtrend. Then in a small zone that is on a 5-minute timeframe, we can create a support area as in the example above.
3.) Identify The False & Successful Breakouts. (demonstrate with screenshots)
When performing technical analysis on trading, the results of the technical analysis that we do will not always give the correct signal, often when doing technical analysis we get false signals. Likewise, by using support and resistance, we can get a successful breakout, or vice versa we get a fake breakout. For more details of successful breakouts and false breakouts, I will explain them below.
1. Successful Breakout.
The breakout is said to be successful when the chart breaks out of the support or resistance area and then the price chart continues the breakout trend. For example, when the chart has a breakout in the resistance area, it means the chart will increase, the breakout is said to be successful when the chart will continue to increase after experiencing a resistance breakout. Successful breakouts are of two types, continuation breakouts and reversal breakouts.
Continuation Breakout
Continuation breakout occurs when the initial trend of the market is bearish then the chart breaks out at the support area, which means the chart will experience a decline because the bearish trend continues its trend which can also be interpreted as a continuation breakout. The continuation condition that I described earlier occurs when the trend is bearish, this condition can also occur when the market is in a bullish trend. more explanation can be seen in the image below.


Reversal Breakout
A breakout reversal occurs when the trend direction signal given when it breaks out of resistance and support is different from the direction of the initial trend. For example, when the price chart is in a bearish trend, then the price chart breaks out of resistance, which means the chart will go up, therefore a reversal breakout is formed. For more details, see the image below.

2. False Breakout
A false breakout occurs when the chart initially breaks out in the support or resistance area, then the chart does not continue its movement as it should and instead returns to the support and resistance area. For more details, see the image below.

In the picture above there are two false breakouts that we can see. First, we can see that the chart has a breakout in the resistance area, which means the chart will increase, but, after a breakout in the resistance area, the chart re-enters the support and resistance zone, which means a breakout in the resistance area is a false signal. Then in the same picture, the chart had a breakout in the support area which gave us a signal that the chart would decline, but after experiencing a breakout the chart support area did not continue its decline and the chart re-entered the support and resistance zone, meaning a breakout in the support area. is a false breakout.
4.) Use Volume and RSI Indicator Combined with Breakouts & Identify the Entry Point. (demonstrate with screenshots).
I will not feel tired to remind you that using technical analysis without the help of other technical analyses will increase the chance of getting false signals that will harm traders. Like the example in number 3, there is a false breakout when using the support and resistance strategy without using the help of other technical analyses. Because of this, it is best when to use a support and resistance trading strategy it is better to combine it with other technical analyses, for example combining support and resistance with the RSI and volume indicators. I will explain how to use it below before I will explain first about the two indicators.
The RSI indicator is one of the most widely used indicators by traders in strengthening the correct signal when conducting technical analysis. This RSI indicator tells us when the market is oversold and overbought. On the RSI indicator, there are 3 zones, the zone below the value of 30 is the oversold zone, if the chart enters the zone below 30 or oversold it indicates we can do a buy entry, the second zone is between the values of 30 to 70, this zone is the neutral zone, and the last zone is the zone above 70 which means the overbought zone, in this overbought zone it gives us a signal to enter sell. For more details, you can see an example of the RSI indicator as shown in the image below.

Traders usually use the RSI indicator by waiting for the chart on the RSI indicator to enter the overbought or oversold zone. But for this time, I will use the RSI indicator differently and combine it with support and resistance. The way we can use the RSI indicator is to use the dotted line at level 50 on the RSI indicator. The 50 levels on the RSI indicator will be used as support and resistance. When the RSI chart is below the 50 levels, the 50 level line will become resistant, otherwise, when the chart is above the 50 levels the 50 level line will become support. For more details, I will explain from the image below.

As can be seen in the image above, I have created support and resistance areas and have also displayed the RSI indicator. As can be seen in the picture above, the price chart is starting to break through the support area of the chart that I pointed to in the picture above, which gives a signal that there will be a decline in the chart that makes us have to take sell entries. For the signal given by support and resistance to be a successful breakout, the RSI indicator must provide the same signal.
Now we look at the RSI indicator, and we can see that the RSI indicator chart before the breakout of the support area was above the 50 level line, which means the 50 level line on the RSI indicator became support. Next, we match the signals given by the RSI indicator and the signals given on support and resistance. Support and resistance provide sell entry signals due to a breakout in the support area, while on the chart the RSI indicator has a breakout at the support level. Due to both technical analyses giving the same signal, we can conclude that the signal given is a successful breakout.
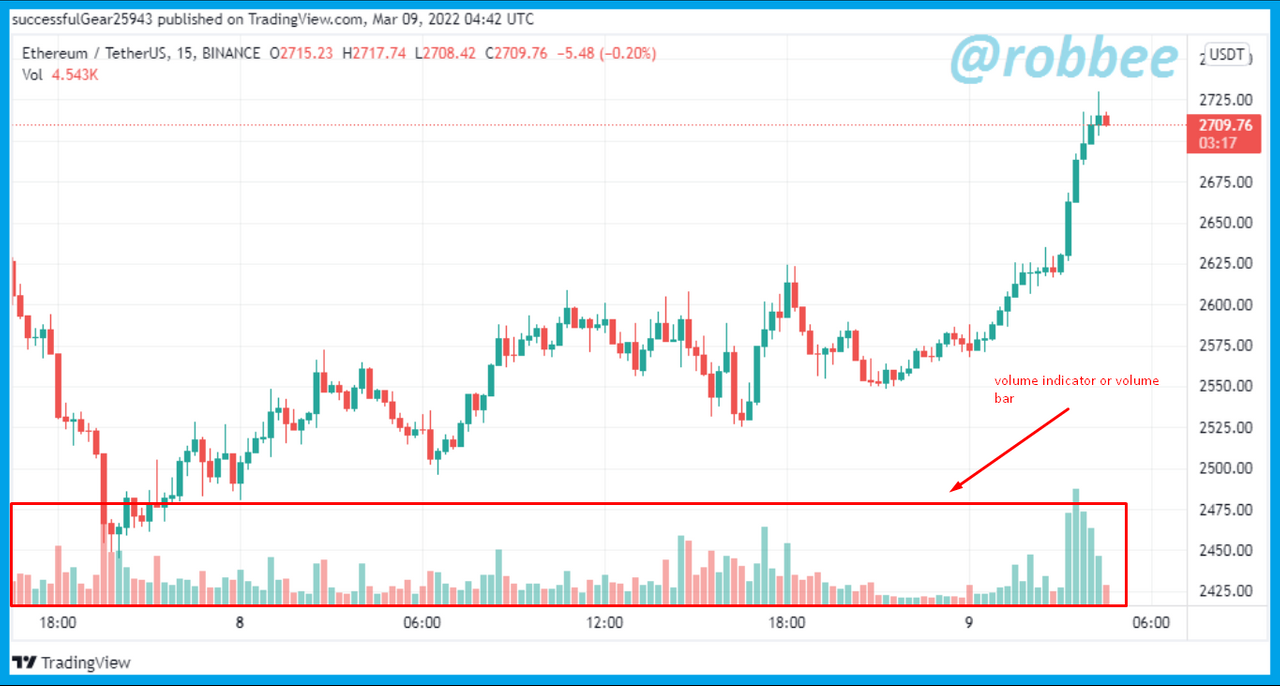
Volume indicator is an indicator that helps us to know the number of transactions that occur in each timeframe. This volume indicator has the form of a bar chart which is usually referred to as a volume bar. To see the size of the trade at that time, you can look at the volume indicator or the volume bar, when the high volume bar indicates the size of the trade at that time, on the other hand, if the volume bar is low, it indicates the small trade at that time. The volume indicator can be seen in the example image below.
How to combine support and resistance with volume bars is also very easy, we only have to see when a breakout occurs at support or resistance followed by a volume bar that gets bigger every time, if this happens then a successful breakout. For more details, see the example below.

As can be seen in the example image above, after a breakout occurs in the resistance area the volume bar gets bigger every time, which means that both analysts give the same signal, so the breakout that occurs is successful.
By knowing the RSI and the Volume bar, then we also have to know how to use all three at once to increase the chance of getting a successful breakout. For clarity, I will explain in the example image below.

As can be seen in the picture above, initially two false breakouts occurred because when the breakout occurred at the RSI and the volume bar did not give the same signal and it was proven that the breakout was a false breakout. At the last breakout, we can see the breakout chart in the support area which indicates the chart will decline and requires us to make a sell entry, before making an entry sell we must see that the RSI and volume bars also give the same signal. As we can see in the picture above after the chart breaks the support area, the RSI indicator also breaks the support level and the volume bar is getting bigger every time which indicates that the RSI and the volume bar are giving the same signal. Because all three give the same signal, it means that the breakout that occurs is successful.
5.) Take a Real Trade(crypto pair) on Your Account After a Successful Breakout. (transaction screenshot required).
To solve a problem no 5, I used the indodax platform in the process. Here I trade using MovieBloc or MBL/IDR coins. For more details, see the image below.

As can be seen in the picture above, I use MDL/IDR coins, here I have created support and resistance areas, and also I have displayed the RSI and volume indicators. As can be seen in the picture above, the price chart has a breakout at the resistance level at the price of 142 IDR or 0.0098 USDT. Then I looked at the RSI indicator, when there was a breakout in the area resistance, the RSI indicator also broke out at the level 50 line where the level 50 line was resistance. Because the RSI indicator gives the same signal for support and resistance, then next I check on the volume bar, on the volume bar we can see that the volume bar will be bigger than before. Because when the analysis gave the same signal, and I was sure that the breakout was successful, I decided to take an entry to buy at the price of 144 IDR or 0.01 USDT at 12:09 pm WIB or 05:30 am UTC.


6.) Explain the Limitations of Support & Resistance (false breakout).
Every technical analysis certainly has its drawbacks, especially by giving false signals, as well as support and resistance. False signals that often occur at support and resistance, for example when the chart breaks out in the support or resistance area, which indicates that the chart will follow the direction of the breakout, but what happens is that the chart does not follow the direction of the break, instead the chart re-enters the support and resistance zone. If traders have taken entry action at the time of the breakout, the traders will experience losses.
Because of this, we can conclude that technical analysis of support and resistance cannot be used alone but must use the help of other technical analyses to confirm the breakout that occurred to avoid a false breakout. We can use additional indicators such as RSI, volume bar, and others.
7.) Conclusion.
Technical analysis of support and resistance in technical analysis and easy to use for trading beginners, how to use support and resistance is also very easy, we just need to wait for the chart to break out in the support or resistance area to take further action. It's also very easy to create support and resistance areas, when the chart is in a bearish trend then the chart stops falling and starts rising again. When the chart stops falling, that's where the support area is, while the resistance area is formed when the chart is bullish, then the chart stops rising and starts to fall. when the chart stops rising, that's where the resistance area is. When the support and resistance areas have been formed, we only need to wait until the chart breaks out at the support or resistance area.
Support and resistance have several types that can be used by every trader according to the needs and direction of the chart. The first is horizontal support and resistance, horizontal support and resistance is the basic form of support and resistance analysis. The second is trendline support and resistance, trendline support and resistance have the form of rising and falling according to the direction of the trend. The third is dynamic support and resistance, this third type usually uses a moving average indicator as an area of support and resistance. And the last one is multi-timeframe support and resistance, this type requires us to use more than one timeframe. The four types of support and resistance above have the same way of use.
What we need to remember when using support and resistance technical analysis is about successful breakouts and false breakouts, this is very important to avoid losses when trading using support and resistance technical analysis. A successful breakout occurs if the chart direction following the breakout follows the direction of the breakout, while a false breakout occurs when the chart experiencing a breakout does not continue its movement following the breakout direction but turns into the support and resistance zone. To reduce the percentage of getting a false breakout we can use additional technical analysis such as adding indicators such as RSI, volume, and others to confirm the breakout signal given by the technical analysis of support and resistance.
References:
https://www.tradingview.com/chart/ITAaNOcQ/
https://indodax.com/en/