Crypto Academy Week 15- Homework Post for Professor @yohan2on on Swing Trading
Hello steemian ...
This is my new post in the Steemit Crypto Academy community, on this 15th week I will be working on a homework from professor @yohan2on with the theme "The Swing trading style".

source:https://www.budakduit.id/2021/01/mengenal-apa-itu-swing-trading.html
Swing trading style is a term in buying and selling shares. Swing trading is a strategy where a trader can make profits in a short time. Swing traders are usually able to get profits in a matter of days and weeks. Even though it sounds easy, we have to really understand what swing style is so we don't suffer losses due to wrong guesses. Therefore, in this assignment I will explain and exemplify things related to swing style.
A Crypto asset pair
This time I will do a swing trading task on the XRP pair.

What's your Entry and exit strategy?
The entry and exit strategy, or in the world of trading can also be called buy and sell, is a strategy to determine when to buy and when to exit. This refers to resistance and support, easily you have to be able to read where you will enter the lowest price and exit the most expensive price. In this case, because we are talking about swing trading, then we are talking about getting a profit in a matter of days or weeks so that the entry and sell must be in close proximity.
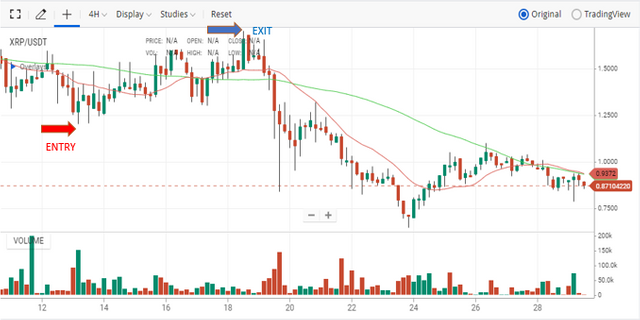
this picture from upbit and edited by me
From the picture above, I have shown you where the entries and exits are. Entries are shown by a red line, namely on May 13, 2021 at a price of 1,212 USD. While the exit is shown by a blue line, which is on 18 May 2021 at a price of 1,692 USD, with a profit of 39.6%.
Multiple time frame analysis
Usually, in observing and analyzing, swing traders usually refer to 3 charts, namely the weekly chart, daily chart and 4-hour chart. Therefore I will show these 3 charts.
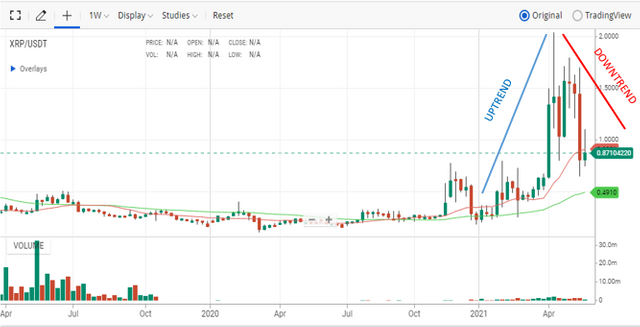
weekly chart (this picture from upbit and edited by me)
On the weekly chart we can analyze that the uptrend occurred on April 1, 2021 (0.538 USD) to April 12, 2021 (2,067 USD). While the downtrend occurred on 3 May 2021 (1.79 USD) to 24 May 2021 (1.09 USD)
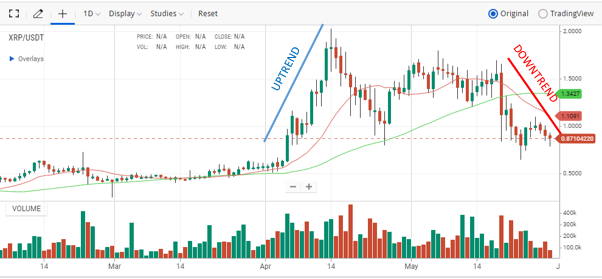
daily chart (this picture from upbit and edited by me)
On the daily chart we can analyze that the uptrend occurred on May 4, 2021 (0.96 USD) to May 14, 2021 (2.02 USD). While the downtrend occurred from 19 May 2021 (1.64 USD) to 29 May 2021 (0.92 USD)
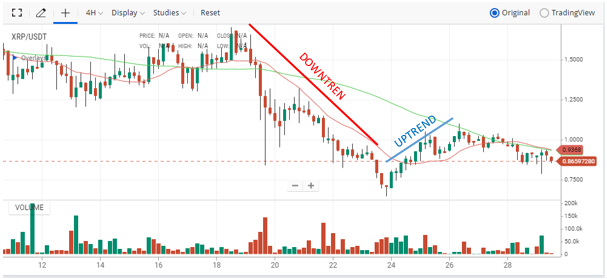
4-hours chart (this picture from upbit and edited by me)
On the 4-hour chart we can analyze that the uptrend occurred on 24 May 2021, 03.00 (0.8 USD) to 25 May 2021, 11.00 (1.09 USD). Meanwhile, the downtrend occurred on 18 May 2021, 19.00 (1.66 USD) to 23 May 2021, 23.00 (0.65 USD).
Candlestick analysis and use of other relevant supporting indicators for your trade decision.
At this stage, I use the Moving Average indicator, namely MA 100 and MA 50. For each chart, there are different decisions for each.
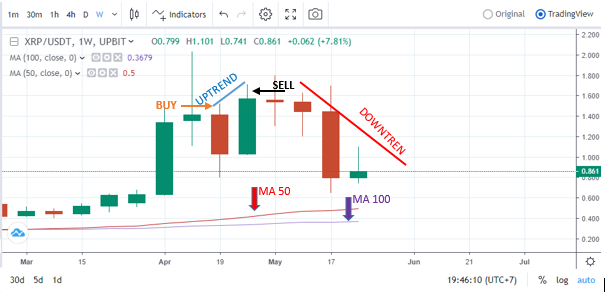
1 week chart (this picture from upbit and edited by me)
On the weekly chart, I decided to buy / enter on April 19, 2021, at a price of 1,514 USD and then decided to sell / exit on April 26, 2021, at the price of 1.703, with a profit of 12.48%
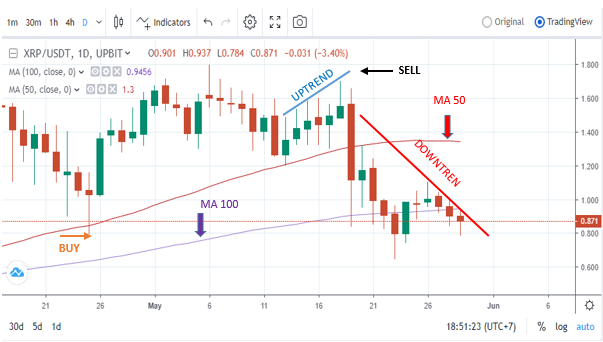
1 day chart (this picture from upbit and edited by me)
Then, on the daily chart, I decided to buy / enter on 12 May 2021, at a price of 1,592 USD and then decided to sell / exit on 18 May 2021, at a price of 1.709, with a profit of 7.35%
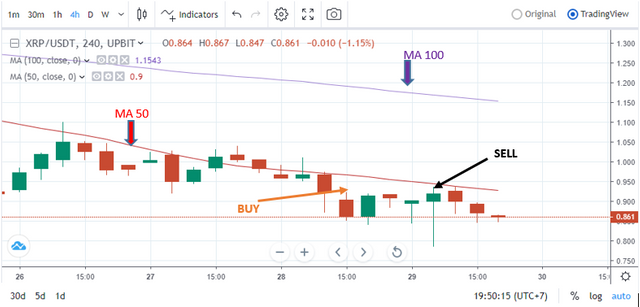
4-hours chart (this picture from upbit and edited by me)
For the latter, on the 4-hour chart, I decided to buy / entry on May 28, 2021, at 15.00 at the price of 0.921 USD and then decided to sell / exit on May 29, 2021, at 07.00 at the price of 0.940, with a profit. 1.9%
In accordance with the philosophy of the swing trader style, where the priority is not big profits, but avoiding risk and also getting profit.
Trade management ( Setting stop loss, trailing stop and take profit)
In setting stop loss, trailing loss and take profit, usually every trading platform has provided them in the settings feature. for example on the upbit platform, you can automatically set a stop loss or in upbit it is called a stop limit.
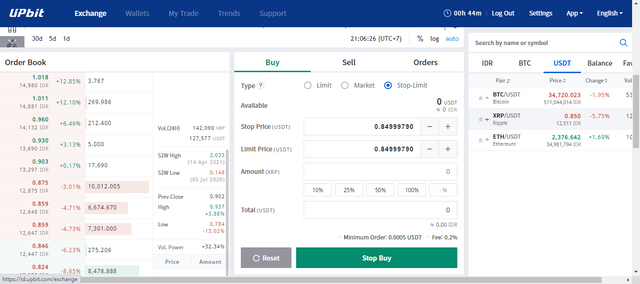
source:https://id.upbit.com/exchange?code=CRIX.UPBIT.USDT-XRP
But manually, stop loss, trailing stop and take profit are values obtained based on chart changes. Here's an example:
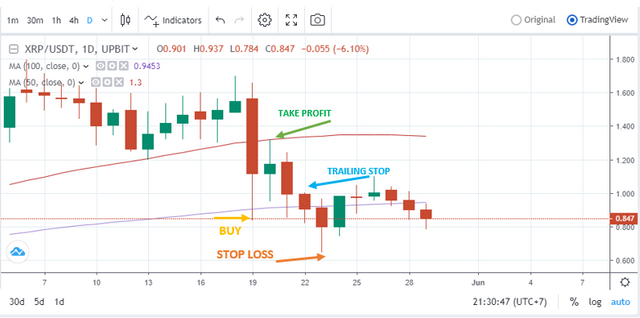
this picture from upbit and edited by me
In the chart, I explain that the trades I do are within 5 days, according to a swing style that focuses on speed. During that time I chose to buy on May 19, 2021, at a price of 0.845 USD, then on May 20 I made a take profit at a price of 1.32 USD (56.21% profit). Then to stop my profit so I don't risk losing, I did a trailing stop on May 22, at a price of 1,011 USD (19% profit). Then on May 23rd, there was a downward trend so I lost money, then I made a stop loss to minimize the loss at a price of 0.649 USD (23.19% loss), that's how trading management is.
Hi @robbee
Thanks for participating in the Steemit Crypto Academy
Feedback
This is generally acceptable content that lacked an in-depth technical analysis. You had to be straight to the point; there was no need for you to explain an entry and exit strategy. You simply had to put strategy across then go ahead by demonstrating it in your trading.
Homework task
5