Confluence Trading - Crypto Academy / S5W6- Homework Post for @reminiscence01
Hello steemian ...
This is my new post in the Steemit Crypto Academy community, on this season 5 week 6, I will be working on a homework from professor @reminiscence01 with the theme "Confluence Trading”.
we will discuss it through the homework below:

1.) Explain Confluence trading. Explain how a trade setup can be enhanced using confluence trading.
Confluence trading is a strategy when trading using more than one trading analysis strategy to get profitable results. Before we decide to make a buy entry or sell entry when trading, of course, everyone will do technical analysis to avoid losses in trading. If we trade without doing technical analysis first, it is like we are wasting money, because we don't know the market will go up or down. Therefore, technical analysis is needed if you want to trade so that we get profits when trading. There are many options for trading analysis techniques that can be used when trading, such as chart pattern analysis, harmonic patterns, indicators, and others.
When analyzing trading techniques, we also cannot guarantee 100% that the results obtained when analyzing trading will be the same in the real market, for example, the results we get when doing trading analysis say that prices will go up, therefore we will make an entry buy, but in fact, the price does not go up but instead goes down which means we experience a loss, this often happens when trading. This case often occurs if we only use one technical analysis, for example, using only one indicator in capturing buy or sell entry signals. as in the example below.
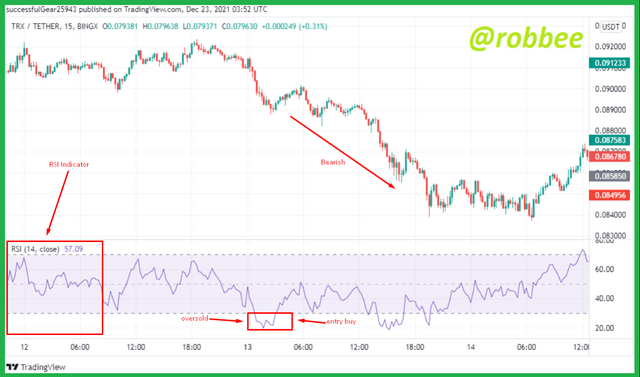
In the example above I used an RSI indicator to get a buy entry signal or sell entry signal. A little repetition of the RSI indicator can give us signals for sell entries and buy entries. On the RSI indicator, there are 3 zones, the zone below the value of 30 is the oversold zone which means a buy entry, the zone between the values of 30 to 70 is the normal zone, while the zone above 70 is the overbought zone which means a sell entry signal. In the picture above, it can be seen that the market is in a bearish state which then the chart on the RSI indicator touches below the value of 30, which is oversold which means a buy signal for us because the RSI indicator gives a signal of a price reversal to become bullish. The price chart is not bullish but instead continues the previous bearish trend, which makes traders who take buy entries at the previous oversold point lose.
To prove that the RSI signal in the above case, I tried to use an additional Bollinger Bands (BB) indicator.
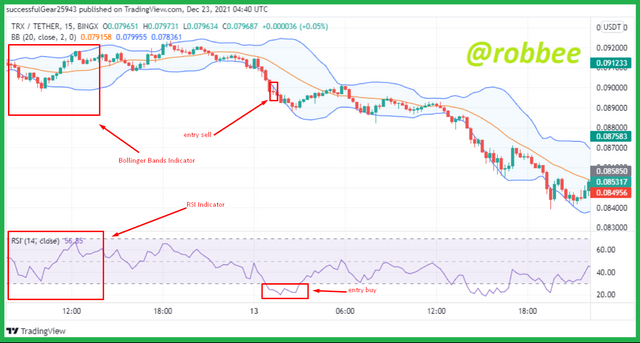
In the BB indicator above, there is one candle that is outside the BB indicator, the candle is below the BB indicator which indicates the bearish trend will continue, while the RSI indicator gives a signal that the trend will reverse, the two indicators give different signals, meaning the signal the RSI indicator above is a false signal which indicates we need to get out of the trade immediately.
When we only use one indicator, we won't be aware of any false signals, therefore we use a confluence trading strategy to filter out false signals like in the second picture above. When using two indicators like the picture above, it makes us aware of false signals that prevent us from entering trades. By using the confluence trading strategy, the signals given by two or more trading strategies must be the same, if they are the same then it indicates the signal given is the correct signal as in the example below.
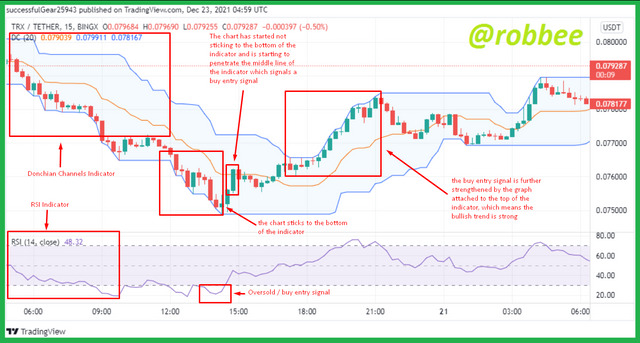
In the picture above I use the RSI and Donchian Channels indicators. The two indicators in the example image above give the same signal. On the chart, the RSI indicator is below the value of 30 which means a buy signal. Then the Donchian Channels indicator has 3 signals that confirm a trend reversal that was initially bearish will turn bullish. In our Donchian Channels, the price chart sticks to the top or bottom of the Donchian Channels indicator, indicating the trend is a strong trend. When the RSI indicator entered the oversold zone, the Donchian channels indicator started not sticking to the bottom of the indicator which means a buy entry signal, then the price chart broke through the middle line of the Donchian Channels indicator which means the trend will turn bullish and then the chart begins to stick to the top of the indicator Donchian channels, which means a strong bullish trend, therefore the RSI and Donchian channels indicators give the same signal and we can start selling entries when the chart has started to break through the centerline of the Donchian Channels indicator.
With the two examples above where the initial example is a false signal and the second example is a correct signal because both strategies give the same signal, meaning that by using the confluence trading strategy we can filter out false signals and enlarge the correct signal and we can get profits in trading.
2.) Explain the importance of confluence trading in the crypto market?
From some of the examples that I have told in #1, we can see that confluence trading is very important if you want to trade. If you want to make a profit while trading all traders should use a confluence trading strategy. Here I will explain why confluence trading is very important if you want to make a profit when trading.
- Increase chances of profit
If you want to increase your chances of making a profit when trading, of course, you will get the right signals when analyzing trading techniques. If we get the right signal when doing technical analysis, we will benefit. Using confluence trading will increase the chances of getting the right signal which will give us profit with the correct signal. For example, in the case, I described in #1, when using confluence trading it will give us a greater chance of avoiding false signals, by avoiding false signals, of course, we will get the right signals. Getting the right signals when using confluence trading will increase your chances of making a profit.
- Minimize the risk of loss
By using confluence trading, we will reduce our losses because confluence trading will reduce us from getting false signals that make us lose. Using confluence trading also gives us good risk management. Even though using confluence trading can't make us 100% free from losses because it's human beings who move market prices that we can't predict, at least we can minimize the risk of loss with false signals when doing trading analysis.
- Filter out fake signals
Filtering out false signals is one of the reasons why we use confluence trading. By using confluence trading we can filter out false signals that are detrimental to us, example in my answer no. 1, when using technical analysis such as using an indicator will give you the risk of getting a large false signal, therefore we use confluence trading for false signals those given can be filtered and we don't enter the market with those false signals. Therefore, confluence trading is very important to filter out false signals.
- Gives confidence when trading
Using confluence trading can also increase confidence when trading, when traders see many confluence of the same signal, it will make traders more confident in the signal. That way traders will be more confident when trading. For example, if you don't use a confluence trading strategy, when a trader gets an entry signal while doing technical analysis, the trader will hesitate and be afraid to enter the market for fear that the signal is a false signal that can harm the trader when using the confluence trading strategy and there are many signal encounters. the same will make traders believe that the signal is the right signal and traders will be more confident in trading.
- Improve your trading skills
When we trade using a confluence trading strategy, we are required to study other technical analyses because we cannot focus on one strategy. The more often we do technical analysis with confluence trading, the more trades will learn about other trading analyses, the more technical analysis that can be mastered will make the trader's ability to trade increase and knowledge of trading technical analysis will also increase, which will certainly increase. the easier it is to get profits if we are more skilled in trading analysis.
3.) Explain 2-level and 3-level confirmation confluence trading using any crypto chart.
If using confluence trading means that we use more than one trading strategy to get the same signal, therefore we must use at least two trading strategies. Here I will explain and provide examples of 2-level and 3-level confluence trading confirmations.
- 2-Level Confirmation Confluence Trading
2-Level confirmation confluence trading means that we use two trading strategies to get the same signal, of course, the function of confirming 2-level confluence trading is to filter out false signals that can harm us in trading and also get the right signal to gain profit in doing so. trading, as an example of 2-Level confirmation confluence trading, can be seen in the image below.
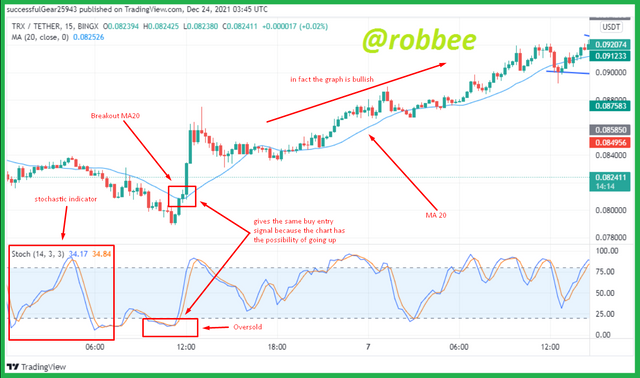
In the picture above we can see that there are two strategies used, and both strategies give the same signal. In the picture above I use a trading strategy using two indicators to get the same signal. The two indicators are the stochastic and the moving average. I purposely used two different strategies with the example in number 1. In number 1 I used the RSI strategy with Donchian channels and RSI with Bollinger Bands, while now I use the stochastic and moving averages which means all strategies can be used but by using more than one strategy.
In the picture above, we can see that the stochastic indicator entered the zone below 20, which means the zone is an oversold zone and there is a possibility that the chart will go up, so we can start a buy entry. Then to see if the signal given by the stochastic indicator is a true signal or a false signal, then I use a moving average indicator with a period of 20. After the stochastic indicator starts to signal the chart will go up, which means a buy entry, then the chart expands through the moving average indicator it means that the chart will soon go up and give a signal for a buy entry. That way both indicators give the same signal, namely a signal that the chart will increase and notify for a buy entry, then both signals are correct and we can start entering the market.
- 3-Level Confirmation Confluence Trading
3-Level Confirmation Confluence Trading means that we use 3 trading strategies to get the same signal, by using 3 strategies the accuracy of the signal will be better than using 2 strategies. The strategy used also does not have to be indicators, we can use other than indicators as in the example below.
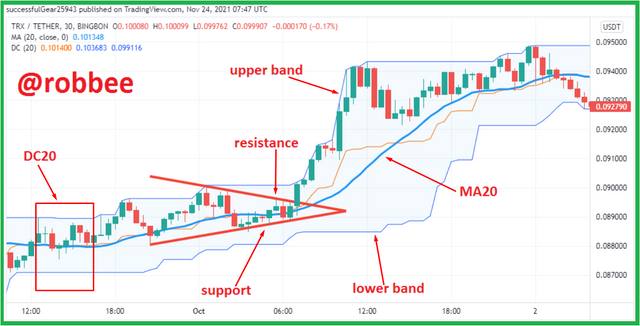
In the example above I used a combination of different strategies again which serves as proof that any strategy used can use a confluence trading strategy. In the picture above I tried to use the Donchian Channels indicator strategy, moving average, and triangle pattern strategy. We can see for ourselves that the three strategies above give the same signal.
In the picture above, a symmetrical triangle pattern is formed, on 01 October 2021 at 07.00 WIB or 00.00 UTC the candlestick breakout resistance in the symmetrical triangle pattern indicates the trend will be bullish.
On the moving average indicator which has a blue line, I use the moving average setting of 20 (MA20). in the picture above we can see that the price chart is starting to break through the MA20 indicator which means the trend will be bullish, the MA20 indicator gives the same signal as the signal given by the symmetrical triangle pattern.
On the Donchian Channels (DC) indicator, after the candlestick breaks out of the resistance of the symmetrical triangle pattern, then the candlestick touches the Upper Band of the DC indicator. After the candlestick touches the upper band on the DC indicator, the next candlestick still touches the upper band on the DC indicator which signals that the bullish trend that is happening is strong. The signal given by DC is the same as the signal given by MA20 and also the triangle pattern is symmetrical which means the signal given by the above trading strategy is the correct signal. The example above is an example of 3-Level Confirmation Confluence Trading.
4.) Analyze and Open a demo trade on two crypto asset pairs using confluence trading. The following are expected in this question.
a) Identify the trend.
b) Explain the strategies/trading tools for your confluence.
c) What are the different signals observed on the chart?
- Entry buy
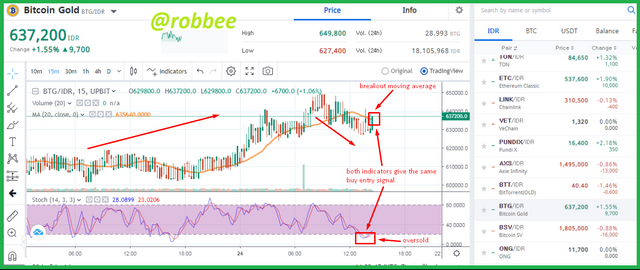
a) To solve this question, I use a trading platform that uses the currency of my country, namely Indonesia, I use the Upbit platform. To take a buy entry like in the picture above, I use BTG/IDR coins with a time frame of 15 minutes. As we can see, the chart was initially bullish and above the moving average indicator. Then the chart changes the direction of the trend to become bearish and the chart also experiences a breakout on the moving average indicator, which means the chart will continue the bearish trend.
b) Then I use a trading strategy using two kinds of indicators, namely the stochastic indicator and the moving average. By using the strategy of the two indicators, to take entry to buy action if the stochastic indicator is in the zone below the value 20, namely the oversold zone and also when the chart is below the moving average indicator which then breaks the chart on the moving average indicator, for entry buy use the strategy above both indicators should give the same signal.
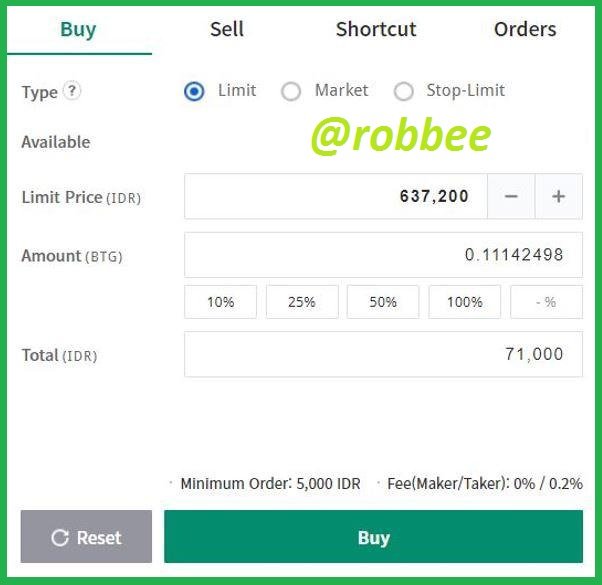
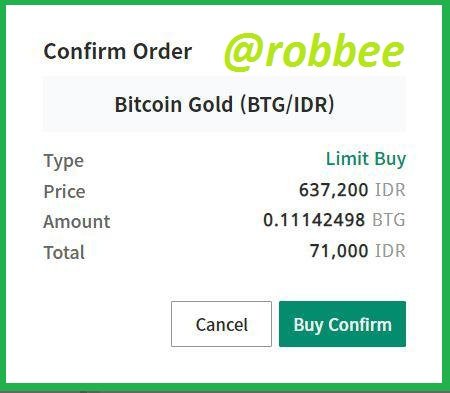
c) As we can see in the picture above, the chart on the stochastic indicator is below the value of 20 which means it is oversold, the stochastic indicator gives us a signal for a buy entry. After the stochastic indicator gives a buy entry signal, the chart breaks the stochastic indicator from the bottom which indicates a buy entry. Since both indicators give the same signal, namely a buy entry signal, enter the market to buy coins at the price of 637,200 IDR or $44.85. From this, I use the 2-Level confirmation confluence trading strategy.
- Entry sell
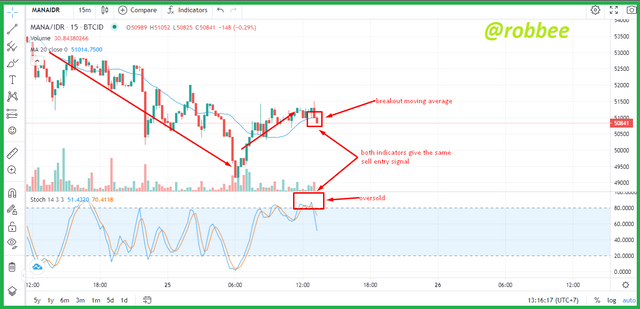
a) For this sell entry I used a different platform from the one I used to do the buy entry above. To do this sell entry I use the Indodax platform. To do this sell entry I use MANA/IDR coins with a time frame of 15 minutes. We can see in the picture above that the price chart is in a bearish trend which then increases by making the price chart break through the moving average indicator and then the price chart begins to move above the moving average indicator.
b) The strategy I use in making a sell entry is the same as the strategy I used when taking the entry to buy action above, namely by using the 2-Level confirmation confluence trading strategy. I use the same indicators for buy entries, namely stochastic and moving averages, the difference is that the signals given for sell entries are different from the signals given for buy entries. We take a sell entry signal if the stochastic indicator is in the overbought zone or a zone with a value above 80, then followed by the chart breaking through the moving average indicator from above which indicates a sell entry. If both indicators give the same signal, we can do a sell entry.
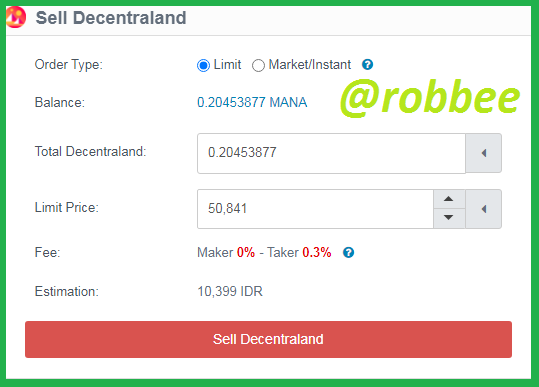
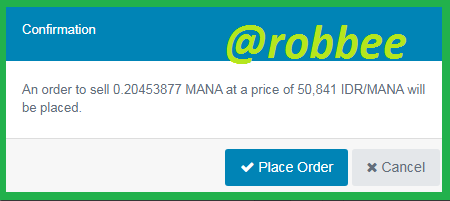
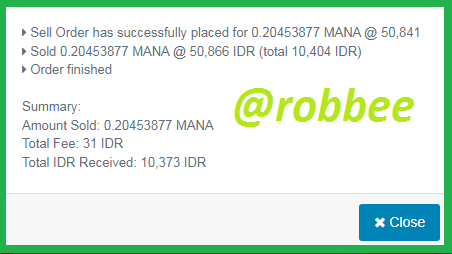
c) As we can see in the picture above, the stochastic indicator is in the overbought zone, namely the zone above the value of 80, the stochastic indicator has given a signal for a sell entry. Then we use the moving average indicator, if the signal given by the moving average is the same as the signal given by the stochastic indicator then the signal is correct, if it is different then the signal is a false signal. In the price chart above, we can see that the chart has a breakout on the moving average from the top which indicates a sell entry. That way both indicators give the same signal, namely a sell entry signal. Therefore the 2-Level confirmation confluence trading strategy was formed and I took a sell entry action. I made a sell entry at the price of 50.841 IDR or $3.57. I sold MANA coins for 0.20453877.
Conclusion
When trading, we can use various trading strategies according to our wishes, but one strategy that we must use when trading is confluence trading. Whatever strategy we use, never forget to use a confluence trading strategy, because confluence trading is a strategy that combines several trading strategies to get the same signal. We can use any strategy provided that there must be more than one strategy that produces the same signal, its function is to notify us of false signals that can harm us when trading. Confluence trading is very much needed when trading, for example, it can increase opportunities for profit, filter out false signals, and others that will certainly benefit us when trading. If we use two types of trading strategies to look for the same signal it is usually called 2-Level confirmation confluence trading, if we use three trading strategies to look for the same signal it is usually called 3-Level confirmation confluence trading, by using more strategies, the results obtained will be better, but we have difficulty achieving the same signal will be increasingly difficult.
References:
https://www.tradingview.com/chart/ITAaNOcQ/
https://id.upbit.com/home
https://indodax.com/en/
Hello @robbee , I’m glad you participated in the 6th week Season 5 of the Beginner’s class at the Steemit Crypto Academy.
Unfortunately, it is observed that your cashout more than your power up. You don't meet the requirement for #club5050 which is a criteria for participating in the homework task.
Remark: Homework Task Disqualified
dear professor, I'm sorry about this and it's my fault. i have checked it every day and only today i forgot to make sure, as you can see that the difference is only a small i.e. 3,258 STEEM. I always try to fulfill these requirements and of course now I have done a power up and you can see it below prof, I hope you can consider giving it a rating again.