Candlestick Patterns - Steemit Crypto Academy Season 4 - Homework Post for Task 10
Hello steemian ...
This is my new post in the the Steemit Crypto Academy Homework Post for Task 10, I will be working on a homework from professor @reminiscence01 with the theme "Candlestick Patterns”.

we will discuss it through the homework below:

2 a) In your own words, explain the candlestick patterns and their importance in carrying out effective technical analysis.
b) In your own words, explain the psychology behind the formation of the following candlestick patterns.
- Bullish engulfing Candlestick pattern
- Doji Candlestick pattern
- The Hammer candlestick pattern
- The morning and evening Star candlestick pattern.
- The Harami Candlestick pattern.
In your words, explain the candlestick patterns and their importance in carrying out effective technical analysis.
candlestick pattern
Part of technical analysis that is widely used by traders to analyze or read the direction of the market in a certain period. This method reflects the impact of investor sentiment on the market. Candlestick patterns are used to determine the right time to enter and exit in trading. Every trader for being one of the very competent strategies to use.

Candlestick patterns can be seen from past market behavior by looking at candlestick charts, by looking at past candlestick patterns so that traders can predict future market behavior by looking at past candlestick patterns.
Importance of Candlestick Patterns in Technical Analysis
This candlestick pattern is very important in conducting technical analysis because the candlestick pattern is one of the techniques that can see the potential price on the chart at a certain period. So traders can find out the impact of investor sentiment on the market. Candlestick has clear rules so it is very efficient to use in analyzing the market, by looking at the color of the candlestick traders can find out which is more dominant between bullish (green) or bearish (red) by looking at the length of the candlestick body and its shadow.There are many candlestick patterns that can be used in technical analysis, so you can choose the candlestick pattern you want to use.
In your own words, explain the psychology behind the formation of the following candlestick patterns.
- Bullish engulfing Candlestick pattern
- Doji Candlestick pattern
- The Hammer candlestick pattern
- The morning and evening Star candlestick pattern.
- The Harami Candlestick pattern.
Bullish engulfing Candlestick pattern

This bullish engulfing pattern indicates that there will be a reversal from bearish to bullish. This pattern occurs if the length of the body shows bullish cover that covers the previous bearish body. Thus, the price changes from initially bearish to bullish.

Doji Candlestick pattern

The pattern is formed because the opening and closing prices are the same, thus forming a candlestick like a striped line. This doji pattern indicates that the forces of sellers and buyers are balanced at the same time. However, the dojo can indicate the market will reverse direction from the previous candle. There are several kinds of doji candlestick patterns. Such as: Dragon Dojo, Gravestone Doji, and long-legged Doji.

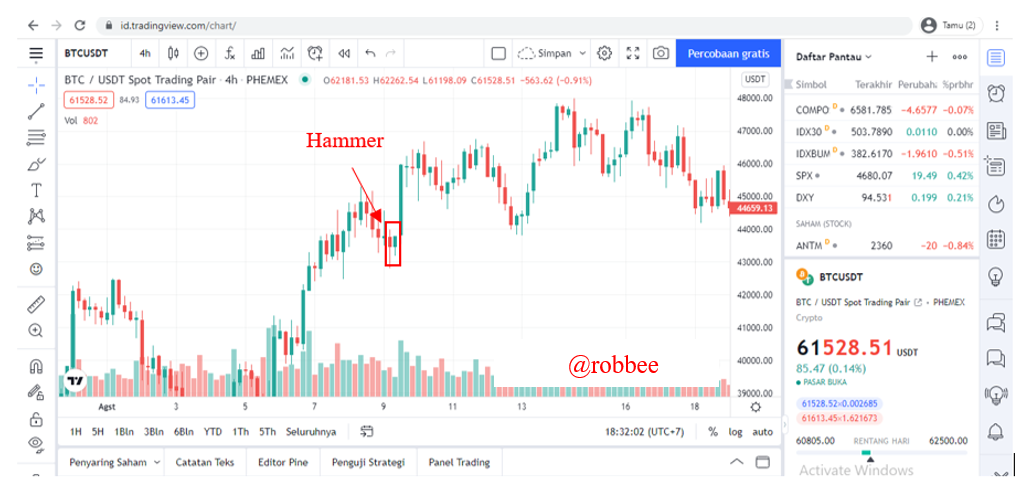
The Hammer candlestick pattern

The hammer pattern indicates a bullish reversal with a tail body that is twice the length of the body. This pattern occurs because the buying power is greater than selling, the formation of a long candle and the price changes so that it leaves a tail that is twice as long as the body. This candlestick pattern is usually located at the bottom, before the candlestick reverses direction. The hammer bearish candlestick pattern has the same concept as the bullish hammer pattern, it's just that the location is different, the bearish hammer pattern is located at the top, before the reversal.
The morning and evening Star candlestick pattern

The morning Star candlestick pattern
This pattern indicates a reversal of the previous downtrend to an uptrend. Has a long body candlestick that is half the length of the body. To indicate this morning star, the doji that is formed can be red or green and can also be colorless, only star-shaped, the most important thing from this morning star is that the first candle must be red and the third candle must be green.

The Evening Star candlestick pattern
This pattern is formed at the top after an uptrend and indicates a downtrend will occur. This pattern is formed if the first candle is green and then the third candle is red and the length of the third candle is at least half of the first candle, then a downtrend will occur. The formation of this poly in a certain period because the seller is in control of the price thus pushing the price to bearish.

The Harami Candlestick pattern

This pattern can occur in a downtrend or an uptrend. This pattern occurs if the first candle has a long body, then a second candle appears which has a very small body, indicating that the market is starting to show doubts, so a price reversal can occur. The price formation that occurs is due to buyers and sellers Compete to dominate the price. Harami candlestick patterns usually occur at the support or resistance section and there is a market reversal.

Conclusions
In trading we must first start with technical analysis. Technical analysis can be done using candlesticks and candlesticks have several patterns. Commonly used candlestick patterns such as engulfing candlestick patterns, doji candlestick patterns, and hammer candlestick patterns. Candlestick patterns are very influential in analyzing because can determine the continued direction of the market, according to the candlestick pattern used.
Do not use the #club5050 tag unless you have made power-ups in the last month that are equal or greater than any amount you have cashed out.
Thank you for the simple and easy post https://9blz.com/bullish-engulfing-candlestick-pattern/