Homework post for @kouba01 || MACD INDICATOR

Analysis before trading in crypto market is an essential tool for better results. Today de in this homework we will learn about moving average convergence divergence technical indicator that is
MACD.
Homework Post by @rinkisaxena

Question 1 :
What is the MACD indicator? Is the MACD Indicator Good for Trading Cryptocurrencies? Which is better, MACD or RSI?

Answer 1 :
- Moving average convergence divergence also known as MACD is a technical indicator used to measure potential exit entry points, strength of a trend and also analyse phase reversal in a crypto market. Gerald Appel was the creator of the most accurate indicator in 1970s.
- This indicator work on the convergence and divergence of several moving averages. It is considered to be the most important instrument in stock market for determining the trends.
- MACD have two lines known as signal line and moving average line. It also consists of zero baseline and a MACD histogram which helps to determine and differentiate the uptrend and the downTrend and of the market.
Calculation of MACD :
The formula used for calculating MACD are :
- For calculating MACD line :
MACD LINE = SHORT EMA - LONG EMA
MACD LINE = EMA 12 - EMA 26
- For calculating MACD histogram :
MACD histogram : MACD LINE - SIGNAL LINE
Here signal line is nothing but the EMA 9 signal present in MACD(12,26,9).
Now let us take an example to make our calculations more visible and clear.

In the above screenshot we can clearly see that
EMA 12 : 3521.74
EMA 26 : 3573.55
EMA 9 : -69.93
So the calculation will be:-

So from the above calculation we can conclude that :
MACD LINE : -51.81
SIGNAL LINE : -69.93
MACD HISTOGRAM : 18.12 ( Green signal uptrend )
You can match these values from the above graph easily.
So now in the second part of this question that is MACD is a good indicator for crypto trading . So my answer is yes ,MACD is a good indicator for crypto trading. It is simple to use and provide strong crypto trading signal. It is one of the most accurate technical indicator which really give the false signals. In the crypto trading several time user use RSI indicator which give false signal. At that time MACD help to find and filter the false signal for smooth and profitable crypto trading. MACD indicator can be used on any time frame depending on user choice.
Now in the third part we have to compare RSI and MACD that which indicator we will use.
So as per my opinion and my study about moving average convergence divergence I will prefer MACD
Because of these reasons :
- It help trader to determine potential exit and entry point.
- This indicator is a complete package of information as compared to other.
- It helps filtering out false signal when used with other indicators such as relative strength index RSI.
- It can determine trend reversal of the market very easily by using histogram technique.
On the other hand the reason why I am not choosing relative strength index is :
- It can remain in overbought or oversold condition for a long period of time which make user tired and confused.
- Relative strength index indicator send false and misleading signals maximum time.
- When the market is showing strong trends then it is impossible to use relative strength index indicator.
So these are the reasons why I am preparing moving average convergence divergence over relative strength index. But if we use both this indicator together then both of them can help each other to filter out false signal and give the trader correct trends and predictions during trading.
Question 2 :
How to add the MACD indicator to the chart, what are its settings, and ways to benefit from them?
Answer :
The process of adding MACD indicator to the chart it's very easy let us see each step one by one.
- Seach tradingview on google or click the link given below.

- Select a chart on which you want to add MACD Indicator

- Click on 'fx' given at top and search MACD. You will find it easily over there . Click on that MACD.

- Now you can see that MACD is set on bottom of chart.

Now let us discuss one by one about the benifits of each signal present in MACD Indicator.
MACD line :

MACD LINE is a line which is and moving average of the difference of EMA 12 AND EMA 26. This line is used to select the perfect exit and the entry point in the market for good profits. When MACD line move upward then it is bullish market and when move downtrends it is Bearish.
Signal Line :

This line oscillate with moving average line and is worked as EMA 9 . It main use is to show trend reversal when it cross MACD line . This line pair with MACD line to give potential entry and exit point.
Zero base line :
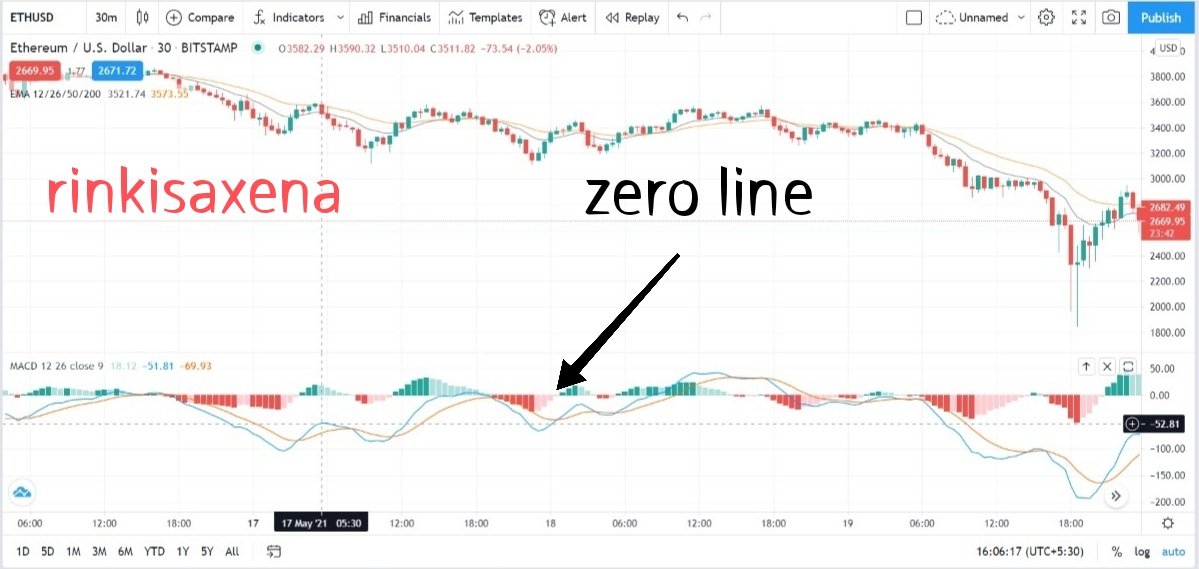
The middle line on which histogram is made is known as the zero baseline. Its value is 0 that means MACD line crosses signal line. At this time histogram will also be shown zero. At this point market change its Trend from upward to downward or downward to upward.
MACD Histogram :

Bars located at zero line are known as histogram. It show relation between MACD and balance line. Its concept is simple that when moving average is moving towards zero line then these histograms show so green Trend in upward direction and when moving averages is moving below zero line then this histogram are moving below zero line in red colour trends.
Inputs :

Indicator time frame helps to change time frame of the indicator. But user always use a bi default time as same the chart has.
Fast length is the length of fast moving average. In this case it is 12 by default and we need the same.
Snow land if the length of slow moving average. In this case it is 26 by default and we need the same.
signal smoothing only show exponential moving average 9 also known as signal line . It is by default 9 and we need the same.
Style :

In histogram we have four different colour features that can be changed as per the choice but right now it is used by default Red and Green as the signals are are used while trading.
We can change colour and graph thickness of MACD line through MACD setting.
We can change colour and graph thickness of signal line true signal setting.
Question 3 :
How to use MACD with crossing MACD line and signal line? And How to use the MACD with the crossing of the zero line ?
Answer :
So we have to discuss two methods to trade in cryptocurrency while using MACD Indicator as :
- Crossing MACD line and signal line
- Crossing MACD line and Zero line
So let us discuss both of them one by one.
Crossing MACD line and signal line :
When MACD line crosses signal line and move upward or above signal line then trader consider themselves in the buy position and secure there asset.
As you can see in the above example of Ethereum usd . The MACD line is below zero line and cross signal line and start moving upward above zero line . This shows a Bullish trend is coming in the Market and trader must confirm his position by buying few asset at cross position.When MACD line crosses signal line and move downward 👇 and below signal line then at that cross trader sell its position and earn profit .
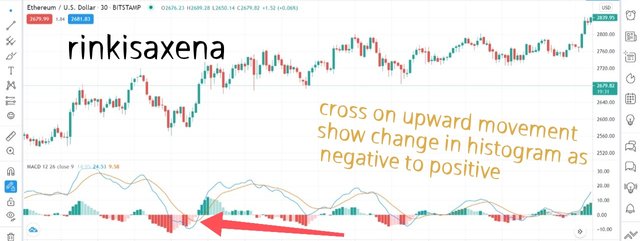
As you can see in the above example of ethereum USD that above zero line signal line cut moving average line and move downward but above moving average line . At this point trader cell its position and earn small profit by stopping his greed as its time for reversal trend.We also use this method to study histogram phase. If signal line cross moving average line on the upward movement then the histogram change from negative to positive and if cross downward movement then positive to negative.


Crossing MACD with Zero base line :
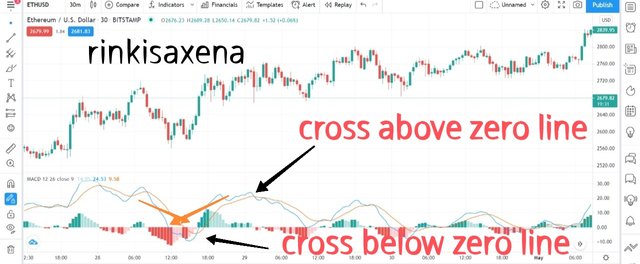
When MACD line crosses zeroline on upward trend then trader consider this situation as potential by signal.
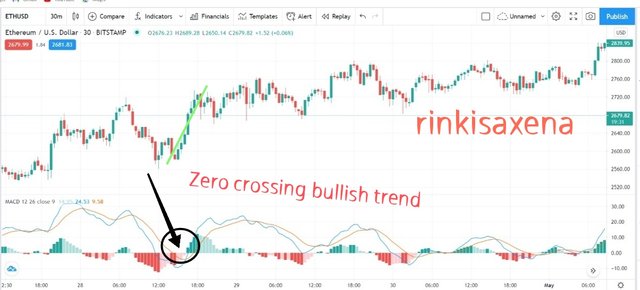
As you can see in the above ethereum USD chart as the moving average crosses zero baseline then market show uptrend which is considered to be the bullish market and this point is considered as bullish crossover. Trader at this point buy assets.When MACD line cross zero line and move downtrends then it is considered as potential sell signal and trader start selling there asset to make profits and exit out.
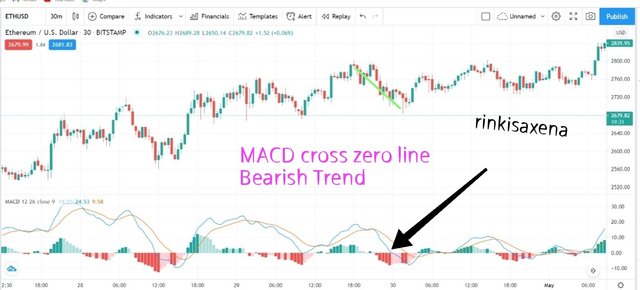
In the above ethereum USD that you can clearly see that the moving average crosses zero line and move download this create a bearish market that show us a reversal Trend . At this point trader sell its asset and exit out its position.Also in bullish crossover moving average and signal line cross each other above zero line and in bearish crossover moving average and signal line cross each other below zero line.


Question 4 :
How to detect a trend using the MACD? And how to filter out false signals?
Answer :
MACD Indicator is one of the most easy Indicator in terms to detect different trends . Let us see four different trends detect by MACD one by one :
Bullish Divergence :
When Price chart trends downward and MACD signal trends upwards i.e. rize from low to high then there is maximum probability of trend reversal and that means market chart will go upward direction. This by of formation known as bullish divergence.
Two easy steps to detect bullish divergence :
- price chart move downward .
- MACD on same position move from low to high.

As you can see in the above ethereum USD chart macd and price chart both moving in opposite directions and due to this there is a trend reversal and market move upwards.
Bearish divergence :
When Price chart trends upward and MACD signal trends downward i.e. fall from high to low then there is maximum probability of trend turns around and that means market chart will go downward direction. This by of formation known as bearish divergence.
Two main rules to detect bearish divergence :
- Price chart move upward .
- MACD on same position fall from high to low.

As you can see in the above ethereum USD chart macd and price chart both moving in opposite directions and due to this there is a trend turn around and market falls and show downtrend.
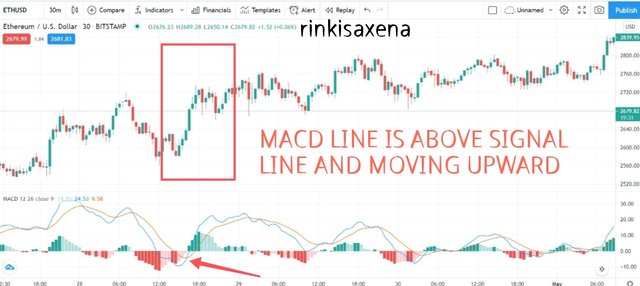
Bullish cross over :
When MACD line crosses signal line and move upward also macd line is above signal line then at the same time price start increasing and market show an uptrend that Uptrend is bullish uptrend. Since we are using macd Indicator and due to cross-over this trend formed so this is known as bullish crossover.

As you can see on the above chart MACD line is above signal line after crossing each other and at the same time price increase. trader must buy some asset during cross-over .
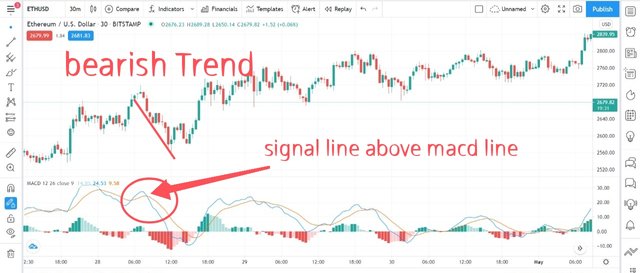
Bearish cross over :
When MACD line crosses signal line and move downward also macd line is now below signal line then at the same time price start decreasing and market show a downtrend that downtrend is bearish downtrend. Since we are using macd Indicator and due to cross-over this trend formed so this is known as bearish crossover.

As you can see on the above chart MACD line is below signal line after crossing each other and at the same time price decrease. trader must sell their asset during cross-over to earn profit and move to potential exit.
Although MACD Indicator is one of the most accurate indicator but every Indicator not always show correct trends some time due to low Volatility in the market Indicators show wrong or false trend . So it is important to filter them to get best results and earn good profits without any barrier.
As we use MACD as a best filter option with RSI . So now it's time to use something new with MACD to filter MACD false signals.
So To filter macd false signal I am using slow Stochastic which is also a momentum Indicator and help us alot in buying and selling process by filtering false signal.

Slow Stochastic is one of the most trustable and used Indicator. It has 2 main points over brought at 80 and oversold at 20.
So, in working with macd it help to detect whether the overbrought position of slow Stochastic is facing correct with macd Indicator or not.
If slow Stochastic show overbrought condition then Macd line and signal line must cross above zero line.
If slow stochastic show oversold condition then Macd line and signal line must cross below zero line.
These are the two main true condition required to trade on filtered signals.
Let us see an example of false signal and true signal on ethereum USD chart .
False Signal :

As we can see in the above chart that slow Stochastic shows overbrought condition and macd signal is below 0 line . Also macd show upward trend before slow stochastic. So this is a false signal as Stochastic showing selling point where as macd showing buying point.
True signal :

As you can see in the above chart that overbrought condition and macd signal both situation satisfy each-other and hence we can say that this is a true signal of selling. As both trends are now showing selling point.
So this is the way in which we can use slow Stochastic to filter false signal and make our trading secure and profitable.
Question 5 :
How can the MACD indicator be used to extract points or support and resistance levels on the chart? Use an example to explain the strategy.
Answer :
It is easy to extract entry and exit points by using Macd Indicator but it is quiet complex when it comes to extract support and resistance. So let see both situation one by one :
entry point :
- When MACD line crosses signal line and move upward and also above signal line then it is considered to be the entry point.
- When macd line cross zero base line and move upward then it is considered to be entry point of trade.

exit point :
- When MACD line crosses signal line and move downward and also below signal line then it is considered to be the exit point.
- When macd line cross zero base line and move downward then it is considered to be exit point of trade.

Resistance and support :
Now to find best resistance and support in graph using macd is quiet difficult. So to solve this problem let us consider MACD Indicator as volatility Indicator.
When you see histograms of Macd from low to zero then you can easily say that market is loosing volatility. These types of histogram trends are considered as clue that 100% market is now going to show strong move . It can be upward trend or downward which we can't decide. So here with the help of support and resistance we can prepare ourselves for such move. Now when price moves it may show any trend . So if it show's upward trend then it is an opportunity for you to sell your asset. But if it go down and breakdown support line then you can short sell your asset so that you can further buy that at low rate to gain profit. So now let us see how to mark resistance and support line using macd.

As you can see above in XRPUSD there is a point where Market is facing low Volatility. This is the point where we can easily mark our strong resistance and support as from now price will change its move .

As you can see that price move uptrend after breaking weak support. Breaking weak support doesn't mean that I have to do shot sell. As you can see price bounce back from strong support. Hence we can say that using macd Indicator we correctly extract out resistance and support lines along with entry and exit points.
Question 6 :
Review the chart of any pair and present the various signals from the MACD.
Answer :
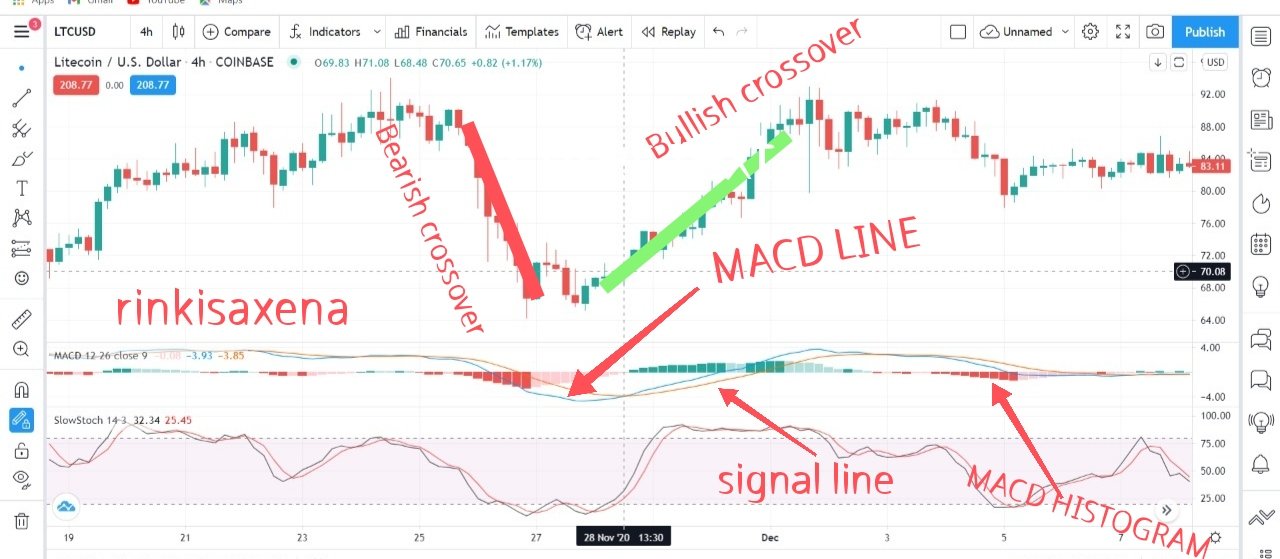
So we are reviewing LTCUSD 4 Hour timeframe chart as professor also use the same time frame. So let us see the 5 main points of MACD and let us see the entry and exit points using filter and macd Indicator.
5 Important points :
- MACD LINE
- Signal line
- Macd Histogram
- Bullish crossover
- Bearish cross over
Perfect entry and exit points :
- For entry point or buying signal let us see the litecoin price chart and follow step to buy asset.

First look at the slow Stochastic graph.when you find a oversold condition where then wait and check the macd curve. When you find that macd line crossing signal line and start moving upward then this point is considered to be the buy point . Buy your asset providing the stop-loss at last swing low.
- Now for exit point or selling point . First we have to look at the chart and then discuss the condition .

First look at the slow Stochastic graph,when you find a overbrought condition then wait and check the macd curve. When you find that macd line crossing signal line and start moving downward and signal line is above macdnline then this point is considered to be the selling point . Sell your asset providing the stop-loss at last swing high and exit your position.
In the above example of LTCUSD we gain profit of more than $ 16.
So this is how we can filter out and find out best entry and exit signal using macd .
Conclusion :
So finally I have completed my homework post by understanding macd Indicator that is used for determination of potential entry and exit points. It is the best tool for determination of trend reversal. After that we see it's more features like signal line and Zero base line . The main thing we understand in this lecture is about filter for macd which is considered to be most useful tool. And finally we analyse trend of one pair of cryptocurrency and conclude my home work.
Thankyou so much professor @kouba01 for this lecture.
Hello @rinkisaxena,
Thank you for participating in the 6th Week Crypto Course in its second season and for your efforts to complete the suggested tasks, you deserve a 10/10 rating, according to the following scale:
My review :
A perfect article that shows the seriousness that you took to answer the questions asked, you succeeded in most of them given the effort committed to research and writing.
Thanks again for your effort, and we look forward to reading your next work.
Sincerely,@kouba01
Thankyou so much professor it means alot to me...