Crypto Academy / Season 3 / Week 8 - Intermediate: Crypto Assets and the Random Index (KDJ)
Hello steemians how are you ? I hope you all are well. Its a great opportunity to read season 3 lectures of the crypto academy and I found it a really interesting and creative way to increase quality content and knowledge. This is the last week of season 3 hope new season will come soon.
Today professor @asaj explain a wonderful lecture on KDJ indicator for trading. After complete analysis and reading now I am submitting my homework post to professor.

HOMEWORK by @rinkisaxena

Question 1:
In your own words explain KDJ indicator and how it is calculated.
Answer 1:
KDJ indicator also known as the random indicator is a technical indicator that was derived from stochastic indicator. KDJ indicator use to analyse the market trends, trend reversal and also provide a trader correct entry and exit from the market. It move with the current market price in the market at default values. This indicator is mainly used at short term trend analysis and it is highly reliable on that time period.
.jpeg)
https://images.app.goo.gl/ADtYBVBEfC3tF7VK6
According to another indicator like stochastic, RSI it also has two conditions Over-brought and over-sold condition that form at above 80 and below 20 level.
It consists of 3 mains lines K line, D line, J line. The working of K and D line is similar to that of stochastic indicator. By cross of Dand K line one can predict Buying and selling signals. The working of J line is to show divergence of K and D line. All these 3 curve are independent of each other and depends on market movement.
Calculation of KDJ indicator :
The calculation of KDJ lines is consists of three main points. The price of day some N day in all three Highest value, Lowest value and closing Value. These are denoted by HN, LN, CN. As we discussed above that KDJ lines are bound in two main conditions that is Over-brought and over-sold condition. So the value lie between 0-100. Another point is if in Calculation the VALUE of K or D Is not given then take it as 50.
Few terms used : N stands for day
RSV : REVERSE VALUE
HN: HIGHEST VALUE OF DAY
LN: LOWEST VALUE OF DAY
CN: CLOSING VALUE OF DAY

In the above image is the given process of calculation. One more thing is that our indicator is designed to 9 period by default value so you have to choose n=9 during calculation.
This is brief discussion about KDJ indicator and it's calculation.
Question 2:
Is KDJ indicator is reliable. Explain.
Answer 2:
KDJ indicator is very much reliable and useful because of its both working style and representation. Let us discuss it's it's working style and representation which make it reliable to a trader :
It represents 3 lines K,D,J and these three lines show a trader both selling and buying points and also the divergence of two D and K lines.
There is a presence of Green and red background which represents uptrend and Downtrend in the market by indicator.
It working is same as RSI, CCI, stochastic and all three are reliable to market so this is also kind off reliable to market and trader. It also work accurate without generating excessive amount of false signals.
with the combination of red green colour and cross of three lines one can easily decides the buy and sell signal in the market.
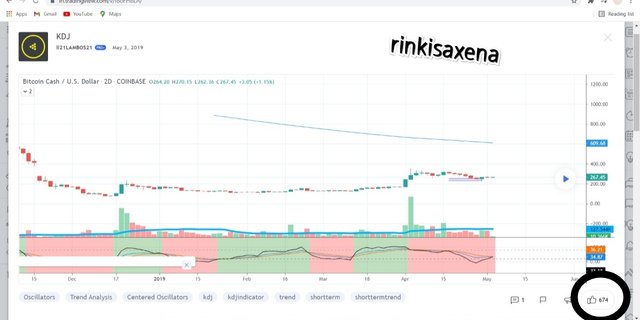
Ability of any indicator also depend on success rate of that particular indicator. KDJ indicator like any other indicator have success rate more than 60% Which is quite good for trade. Also on tradingview II12LAMBOS21 have 674 Likes.

Since every indicator at some point produce false signal so to maintain the stability in market by using indicator we can choose another indicator with KDJ indicator to make our trade more worth and confirmed. Why using any indicator reliability also depend on traders mind if trader it is full of greed and fomo then using any indicator will not give them profit and may provide them huge loss. Provide trading with any indicator one should have calm mind.
Question 3:
How to apply KDJ indicator on chart and what are the recommended parameters.
Answer 3:
To apply KDJ indicator on chart we have to follow some somoy steps given below :
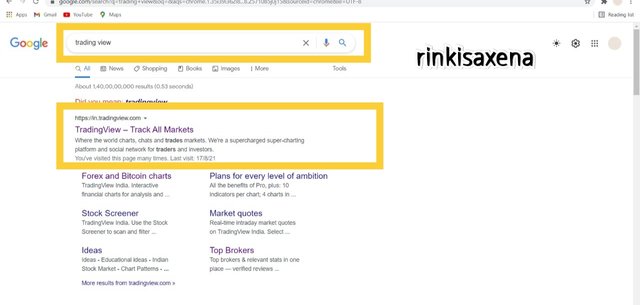
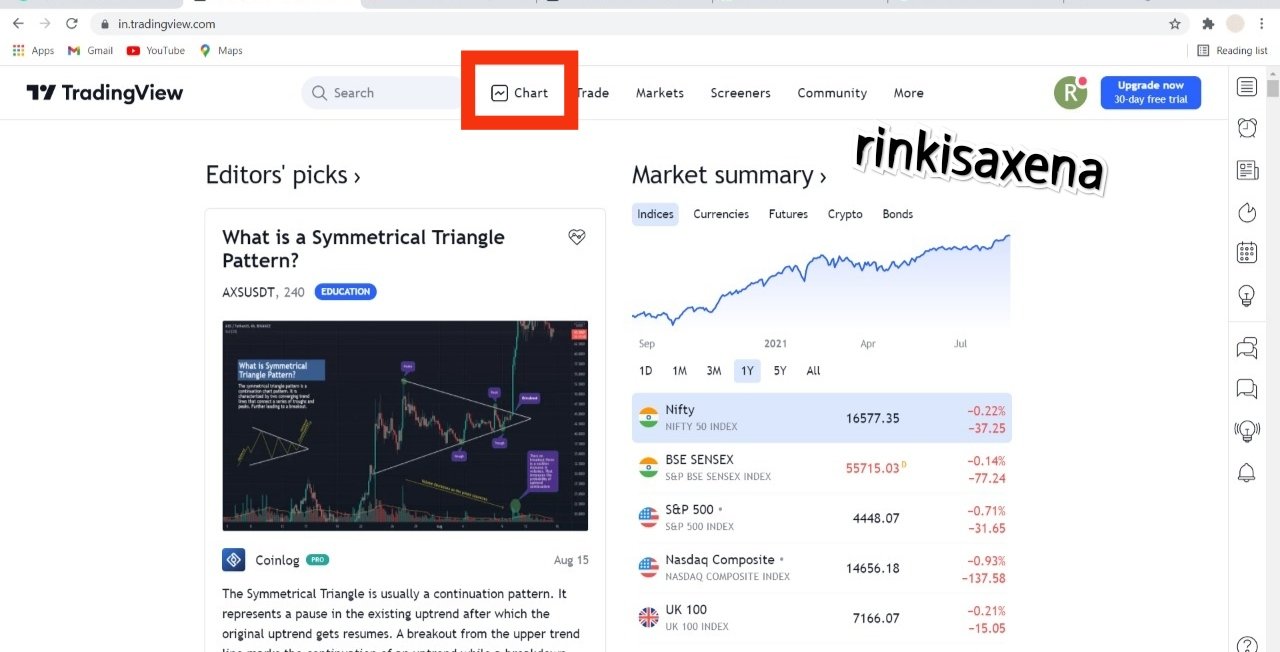
First search trading view on Google and click on the first link of tradingview main website.
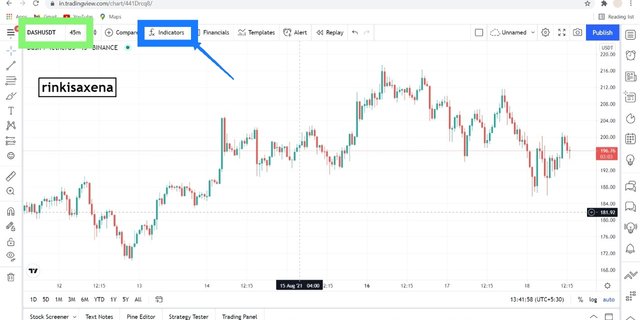
You can see at clear interface of tradingview click on the chat option given on the top of the taskbar and apply a chart which you want to use for your trading and applying KDJ indicator.

Now click on Fx indicator, option contain all the indicators that are available on tradingview and you can search the indicator.
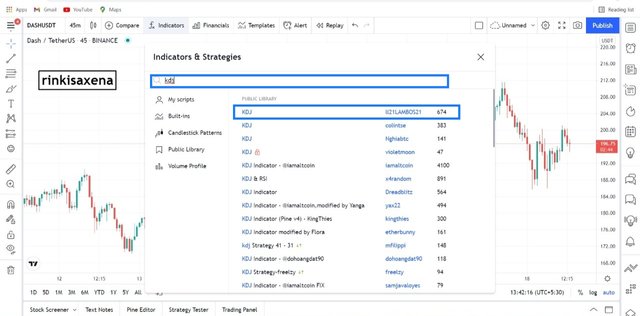
Search KDJ indicator on search bar and Click on the first link given which is your main indicator.
As you can see on the bottom of the chart random KDJ indicator is applied having 3 lines and 2 colour trend shows uptrend and Downtrend.
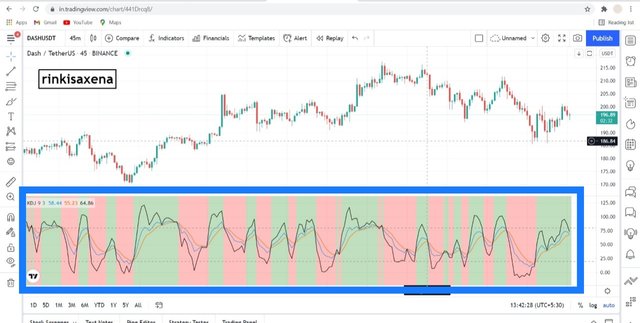


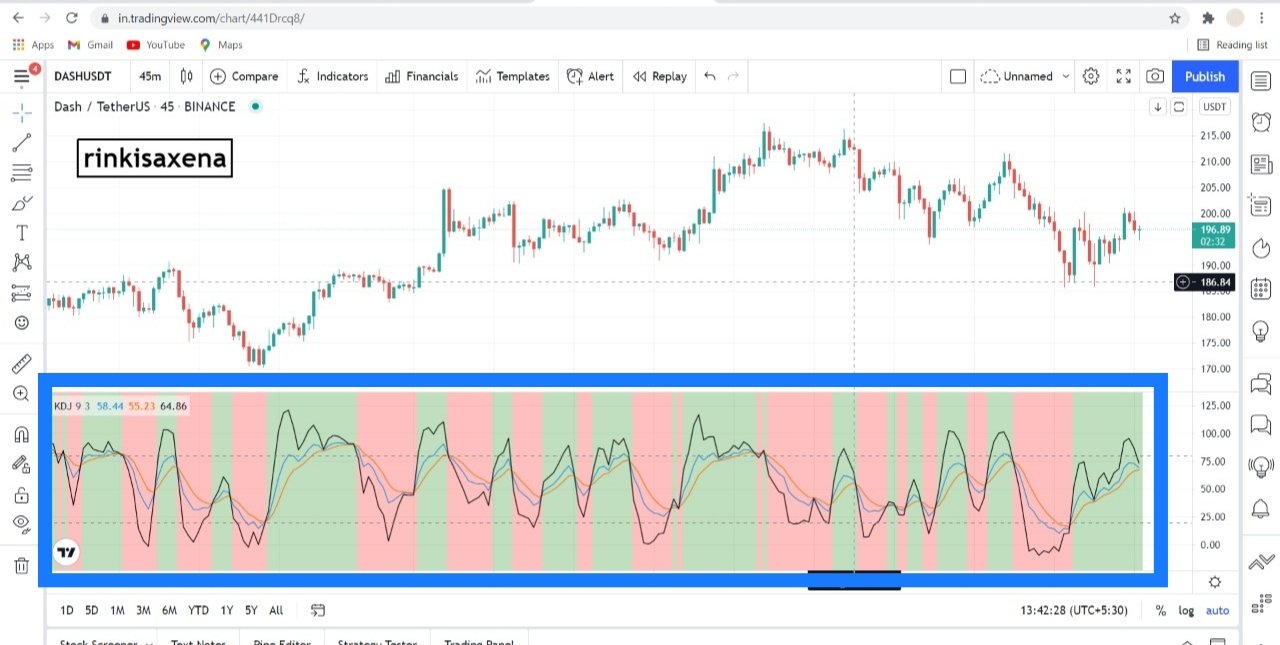
This is how we have to apply KDJ Indicator on chart and then let us see the settings available in KDJ Indicator.
There are three main settings available in KDJ indicator that are input, style, visibility. Let us discuss them one by one.
Input:
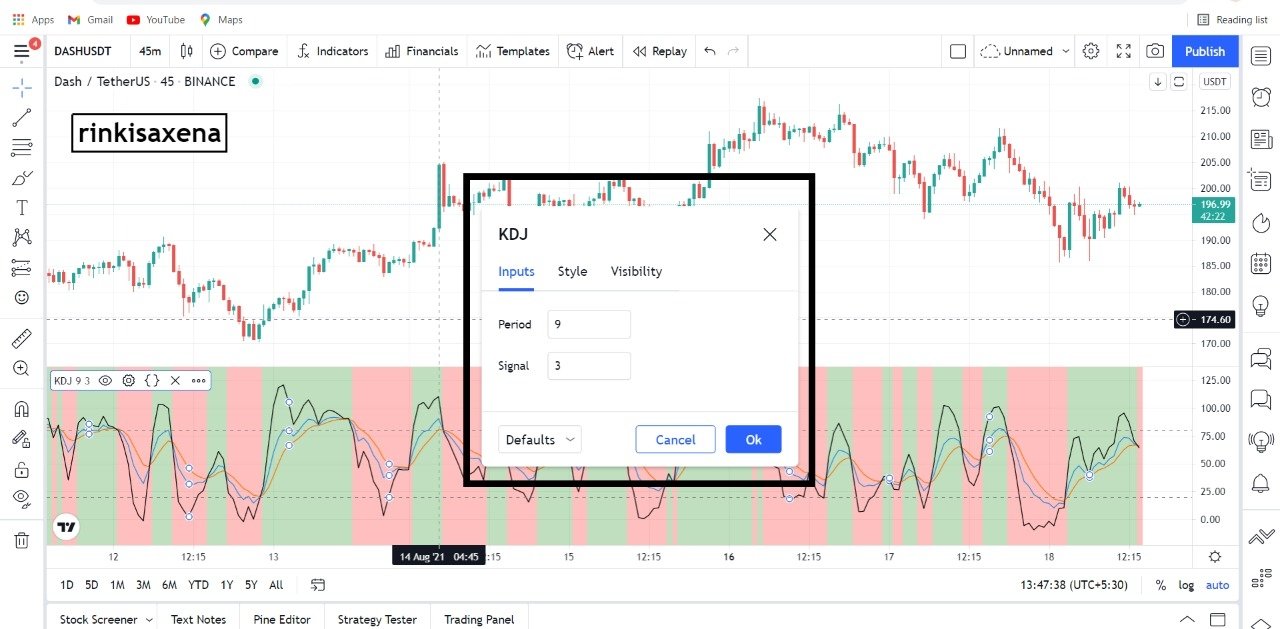
It consists of 2 options period and signal. Both are by default 9 and 3. 9 is the period that means 9 days, month, week, mins and so on. 3 are number of signals moving in an indicator that is K,D,J lines.
Style :

It consists of colour of both lines and background. By default colour of lines are K: BLUE, D: ORANGE and J: BLACK. Colour of background is Red and green at low % of brightness. There is also the presence of level of both over brought and over sold condition. These values are also by default 80 and 20 which also consider to be more realistic and reliable.
Visibility:

It represents the time period and range of the data at which an indicator is working all these values are also by default set.
Recommend parameters:
The main recommend parameters of KDJ indicator are :
Period or Length is to be set by default 9 because it is the most reliable and accurate in trading withKDJ indicator.
To determine Over-brought and over-sold condition the level of style lines should also be fixed on 80 and 20. These two levels will provide us Over-brought and over-sold conditions.
Over-brought :
When J line move above 80 then it is considered to be an Over-brought zone. This zone represent upcoming trend reversal in the market. Let us take a chart and check at which position we are getting Over-brought zone.

Over-sold :
When J line move below 20 then it is considered to be an Over-sold zone. This zone represent upcoming trend reversal in the market. Let us take a chart and check at which position we are getting Over-sold zone.

Time period choose for trading must be a short term time frame to get most accurate and good trend results in the market.
It is also recommend to make understanding correctly above uptrend and Downtrend and never make a trade just on cross. Wait for one candle break otherwise cross may give you false results.
How to determine downtrend and uptrend with background colour:
Uptrend :
When J line move above K line and D line. Also in same phase K line is above D line then it is correct signal of uptrend. Let us take a chart to get more clear understanding of uptrend.

Downtrend:
When J line move below K line and D line. Also in same phase K line is below D line then it is correct signal of downtrend. Let us take a chart to get more clear understanding of downtrend.

These are the recommended parameters that one should understand before using KDJ random indicator in trading and analysis.
Question 4:
Different between KDJ, ADX and ATR indicator.
Answer 4:
Let us take few minutes to give difference between KDJ, ADX, ATR on different parameters :
| Parameters | KDJ | ADX | ATR |
|---|---|---|---|
| Full form | It is known as Random Index | It is known as Average Directional Index | It is known as Average true range indicator |
| Indicator interface | It consists of Three lines | It consists of Single line | It is also a single line |
| Working | It is use to determine buying selling signals with Over-brought and over-sold setup. Also determine trend reversal in market. | It determines the strength and Trend (weak or strong) in the market but unfortunately don't provide buying and selling signal | It is use to measure Volatility in the market aand unavailable to provide buying and selling signals. |
| Period or Length | Its period Is by default 9 | Its period Is by default 14 | Its period Is by default 14 |
| Calculation | It has basic calculation and formula | it's calculation is quite complex. | It's calculation is quite complex and lengthy. |
| Buying and selling signals | It don't require any other indicator to generate it. | It requires DI indicator to generate it. | it also requires DI Indicator to generate it. |
| Time frame | Good working in short time frame | Work good in mid-term and long term | Work good in mid-term and long term |
Let us take an example of each indicator by applying it on chart.
KDJ :

ADX :

ATR :

Question 5:
Apply KDJ and perform buying and selling of cryptocurrency trades (2).
Answer 5:
Let us take two cryptocurrency pairs to make trade using random indicator KDJ which will help us to make buy and sell signal in the market. For our trade we are taking BTCUSD and LTCUSD at 3 mins timeframe.
BTCUSD buying and selling signals :
Buying:

When J line move above K and D line. Also K is above D then there is a upcoming uptrend. So just after the crossing of three we buy our trade of BTCUSD at 3 mins timeframe. 100 assets buying at @ $45,385.41.
Selling :

When J line cross and move down K and D teh sell trade as it is a signal of trend reversal or sell asset when J line cross above Over-brought zone. In this case we sell asset in over brought condition when J line cross 80 and move to 90 value. Sell 1 asset at $45455.92 and rest 99 shares at $45461.34. in this we secured good profit.
LTCUSD buying and selling signals :
Buying:

When J line move above K and D line. Also K is above D then there is a upcoming uptrend. So just after the crossing of three we buy our trade of LTCUSD at 3 mins timeframe. 1 asset buying at @ $170.38.
Selling :

When J line cross and move down K and D teh sell trade as it is a signal of trend reversal or sell asset when J line cross above Over-brought zone. In this case we sell asset in over brought condition when J line cross 80 and move to 92 value. Sell 1 asset at $170.60 in this we secured good profit.
Total profit :
Starting amount $100000
Ending amount $107584.80
Profit : $7584.80
This is how we have to trade using KDJ indicator on price chart at short time frame.
Conclusion:
So, finally it is time to summarise our homework post in which we discuss about KDJ indicator which also known as Random Index. It is a technical indicator use to analyse market trend, trend reversal and also perfect entry exit point in the market.
It consists of 3 main lines K,D,J lines that help us to analyse the trend and make entry and exit from Market. It is similar to stochastic indicator and have the same Over-brought and over-sold level as stochastic.
If J line is above K and D then it is signal of uptrend and when J line is below K and D then it is signal of downtrend. From here we can also say that K is above D is an Uptrend and K is below D is a downtrend.
This is all about my homework post. Thankyou so much professor for such an amazing lecture.
Superb performance @rinkisaxena!
Thanks for performing the above task in the eighth week of Steemit Crypto Academy Season 3. The time and effort put into this work is appreciated. Hence, you have scored 10 out of 10. Here are the details:
Remarks
You have displayed a good understanding of the topic Rinki Saxena. You have completed the assigned task. Your have performed the tasks in a commendable fashion.
Thankyou so much professor
You have been upvoted by @sapwood, a Country Representative from INDIA. We are voting with the Steemit Community Curator @steemcurator07 account to support the newcomers coming into Steemit.
Engagement is essential to foster a sense of community. Therefore we would request our members to visit each other's posts and make insightful comments.
Thank you