Steemit Crypto Academy Season 3 Week 2 - Beginner's Course | Introduction to Charts for @reminiscence01 by @reza-khem
Hello steemians friends, I haven't taken crypto classes for a long time because I'm in education, but on this occasion I'm trying to take crypto classes from my beloved professor @reminiscence01.
There are 4 questions given by the professor, and I will answer the questions one by one.
Question 1: Explain the Japanese Candlestick Chart? (Chart screenshot required)
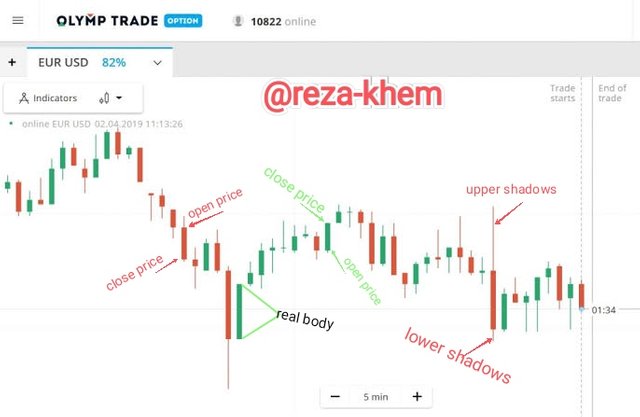
Candlestick charts are technical analysis tools to find data on an asset in the past and also ongoing trends, data collection using candlestick charts is very complete compared to other charts. In addition, there are some terms or understandings that we must first learn from candlestick charts before we can use them.
Candlestick charts use a candle-like design, followed by upper and lower shadows. In the middle of the candle is called the real body, this real body is to separate the distance between the opening price and the closing price. Upper shadows show the highest price at a certain time while lower shadows show the lowest price at a certain time.
If the green or white candle indicates that the price movement is in an uptrend or we can call it bullish, the real body with green or white color indicates the opening price is lower than the closing price on the bullish candle. While the red or black candles indicate the market is in a bearish stage, if it is like this the red or black real body will indicate the opening price is higher than the closing price.
Upper shadows will separate the price of the upper part of the real body with the highest price in a certain period, while the lower axis is called the lower shadows which is the separator between the lower price of the real body and the lowest price during a certain period.
Question 2: Describe any other two types of charts? (Screenshot required)
1. Bar Chart
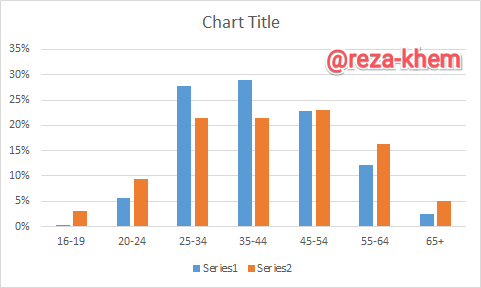
Bar charts use vertical bars to publish data, each bar will display the high, open, clise, and low price for a certain period. Let's give an example for the H1 timeframe bar, at the beginning of the open the bar is called the open this is the first to be recorded, then within an hour the highest and lowest prices are reached, after which there will be a closing price after 60 minutes.
The closing price at a certain time is lower than the opening price, then the bar will be red. And vice versa, if the closing price is higher than the opening price, then the bar will be green, this is almost the same as a candlestick.
2. Line Chart
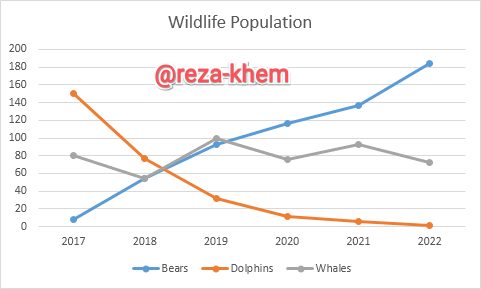
Line charts are very simple charts and are not very complete compared to candlesticks and bars because they only show closing prices, so you won't be able to see the highest, lowest, or opening prices on the line chart. On the line chart the closing values represent one period. For example, like the hourly price of an asset, the price movement of an asset during one is only represented by the closing price at the 60th minute. After that a line is drawn to connect the closing price once every hour and synchronize with others.
Line charts are very simple and difficult to use for short-term or one-day technical analysis, line charts are more often used for long-term analysis.
Questions 3: In your own words, explain why the Japanese Candlestick chart is mostly used by traders
There are several reasons in my opinion why Japanese candlestick charts are widely used by investors or cryptocurrency activists to analyze the market or coins, including:
Candlesticks provide more complete information than other charts, with candlesticks we can analyze the market at a certain time even in a matter of hours or months. The data presented is also very complete, such as the price of opening, closing, high, low, as well as upper shadows and lower shadows, this is certainly a plus compared to bar charts and line charts.
Candlesticks can also quickly identify changing market trends in just minutes and hours.
The characteristics possessed by Candlesticks are very easy for users to analyze the market with red and green or white and black which indicate a bullish and bearish market, besides that uptrend and downtrend trends are very easy to find on candlestick charts.
The visual information presented is also much more than other graphics.
Questions 4: Describe a bullish candle and a bearish candle identifying its anatomy? (Screenshot is required)
Candle Bullish
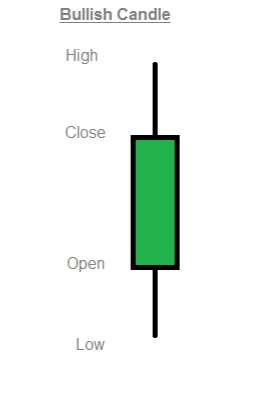
The bullish candle indicates the closing price is higher than the opening price, and is green or white in the real body of the candle. There are 4 anatomy used by bullish candles, namely, high, close, open, and low price, the real body separates the closing and opening prices, while the upper shadows and lower shadows show the highest and lowest prices.
Bullish candles also feature trend lines, support levels, momentum, volume indicators, etc., all of which we can use to validate bullish candle patterns. Bullish candles are able to show buying pressure from buyers and also show the supply that sellers are able to provide.
Candle Bearish
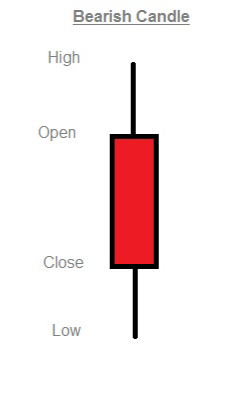
This is also the same as a bullish candle, only bearish shows the opposite side of the bullish. Bearish candle shows the closing price is lower than the opening price because the market is in decline, and also has 4 anatomy, namely, high, close, open, and low price.
Hello @reza-khem , I’m glad you participated in the 2nd week of the Beginner’s class at the Steemit Crypto Academy. Your grades in this task are as follows:
Recommendation / Feedback:
Your article is almost same with some articles i have reviewed. Try to be more creative and outstanding in performing your homework task and you will see the outcome in your grade.
Thank you for participating in this homework task.