Starting Crypto Trading - Steemit Crypto Academy |S6W1 - Homework Post for Professor @pelon53

Question 1

The price of a commodity can be affected by different factors, and the in-depth study and analysis of these factors can be said to be fundamental analysis. It is looking into the circumstances surrounding the market behaviour and price action. It is an analysis carried out without the use of the chart and indicator tools.
In the foreign exchange market, the fundamental analysis consists of being up to date with financial happenings and new financial policies and also political changes as all these could cause a change in price, and affect the pairs being traded. The crypto market is not far from that, the major difference is that this time, the market is not particularly centralized.
The Fundamental analysis in the crypto market is the study of events and news or happenings that will in one way or the other affect the demand and supply of a crypto commodity. It is a very important type of analysis and can be done by almost anyone that understands the law of demand and supply and the factors that affect it.
In the foreign exchange market, major events cause very formidable buying or selling pressure, whatever the case may be, and these can be caused by announcements of high unemployment or lower interest rates in the country or other announcements also like change in power e.t.c This is also not too far from the crypto market, the difference is that the news traders look out for in the crypto market is different.
When fundamentally analysing a crypto commodity, we look at the project type and plan and the roadmap, we also look out for new collaborations with bigger brands or news of the project's token being listed on big exchanges like finance or major token improvement changes like burning of tokens which would increase the demand to supply ratio and therefore affect the price. Let's carry out a brief fundamental analysis on the Anchor protocol (ANC) and see the changes that occurred in price when it was listed on Binance.
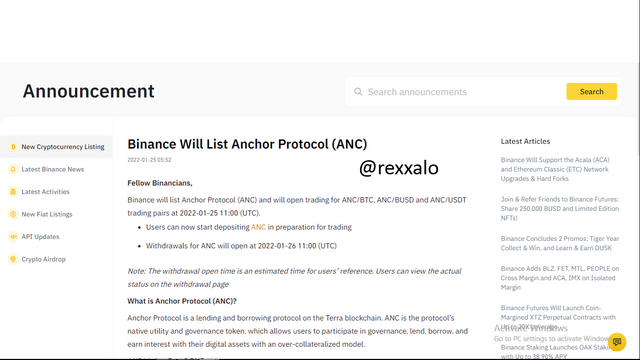
The image above shows that finance announced that it was going to list the anchor protocol token sometime last month, 2022-01-25 to be precise. Now let us check the price's response to this, to do this. To do this, we would have to trace the date of the announcement on the chart, and I will be using tradingview to do this.
r
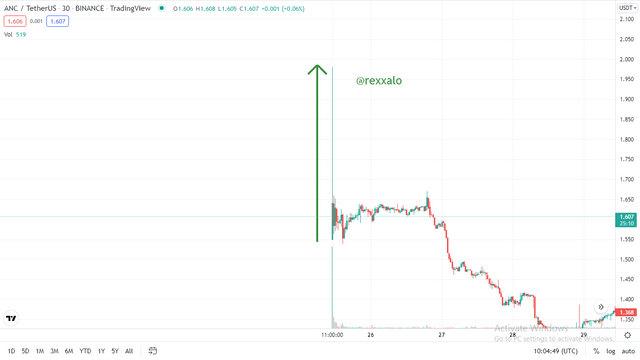
From the chart above, we can see the very long green candle which started the ANC chart and this candle corresponds with the binance announcement date, even though the buying move was really fast and strong, it was also followed by an almost equal selling pressure, so we should note that the crypto events do not always cause a move in one direction.
Fundamental analysis is very important for all traders because sometimes technical analysis can be confusing and the chart might not be leading traders in any direction, causing them to make wrong decisions, but the fundamental analysis acts as a guide and a shade for all traders to run back to. It can also be used in combination with the technical analysis to achieve better results. Fundamental analysis is more concentrated on precise happenings and will hardly mislead a trader, but it might also turn out to have a weak response or also go in different directions than predicted.
Question 2
Technical analysis is very different from fundamental analysis. In technical analysis, traders make use of the charts, indicators and try to spot trends, resistance and support price levels and also trend reversals. Fundamental analysis has a main focus on news and events of the project, but technical analysis has a different approach.
The technical analysis combines values and information of previous market structures and behaviours to possibly dictate the next movement of the market. It also takes into consideration, the trading psychology of the traders, and so on this basis, the market moves in a pattern that could be studied and understood. As I have stated before also, technical analysis involves the use of more tools like indicators and trend lines.
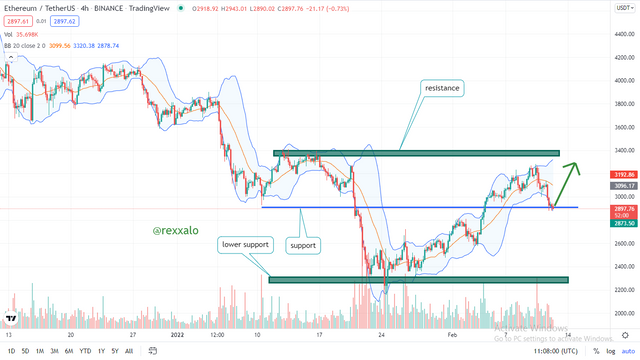
The chart above is a chart of the ETH/USDT pair, and I have applied the Bollinger band indicator and I have spotted the possible resistance and support levels using a 4-hour chart. When we spot support and resistance ranges, we expect that price bounces off that area and this then influences our trading decisions.
I have used a traditional Japanese candlestick as an example, but there are other types of charts that will aid in carrying out technical analysis. Reading the charts and combining it with good trading strategies is a good way to utilize technical analysis.
Technical analysis also ensures that traders find precise entry points to enter the market with and also helps curtail the risks taken in each trade with the use of risk to reward indicators available.
Differences between fundamental and technical analysis
| FUNDAMENTAL ANALYSIS | TECHNICAL ANALYSIS |
|---|---|
| Fundamental analysis makes use of information gotten from economic reports like interest rates, unemployment rates, and new bank policies, to predict price change and markets direction | technical analysis uses data gotten from former price data like market volumes, chart shapes and patterns like the falling wedge, and indicators to predict market behaviour |
| Fundamental analysis is very useful when analyzing for long term investments | Technical analysis is mostly useful for short term traders |
| Fundamental analysis gives no room to analyze the psychology of the available traders in the crypto market. | Technical analysis makes use of studying the psychology of the buyers and sellers of the market. |
| In fundamental analysis, there is nothing that tells the traders when and where to enter the market because it only deals with the current and true price of the commodity | in technical analysis, with the use of indicators, traders can gain knowledge of entry and exit points in the market. |
In my opinion, these two should not work separately, and a good trader would know that it is necessary to use them hand in hand to gain more accuracy when buying or selling.
Question 3
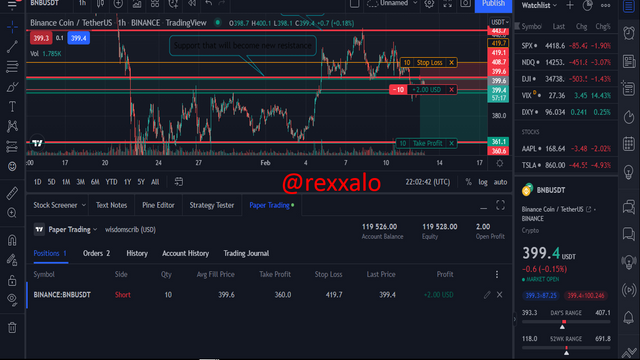
For this question, I will use the BNB/USDT pair. On the chart below, we can see that I have highlighted with a line the resistance and support prices, and I have made sure to keep this chart's time frame on the hourly time frame as instructed. My sell order has been placed and when it was, it started with a loss, I have chosen to use a risk-reward of 1:2 as seen below and now we wait for the market to follow the analysis.
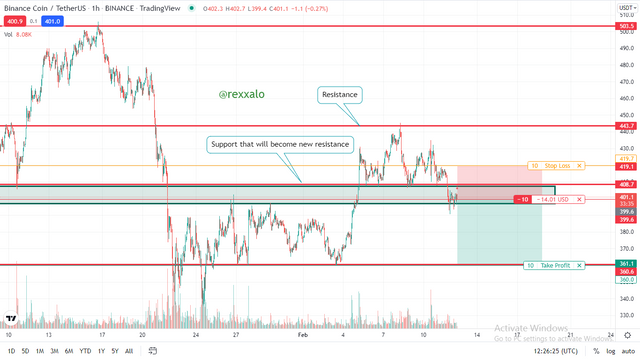
In the chart above, we can see that price is at former resistance and I am being optimistic that that same level will have a strong selling effect on it, and so I place my trade there, and even if it does not start selling from there, I believe also that the former support above the price will act as new resistance.
Question 4
To answer this question, I will be using the SOLUSDT pair. On the chart below, we can see that I have highlighted with a line the resistance and support prices, and I have made sure to keep this chart's time frame on the 4-hour time frame as instructed. My buy order has been placed and I have chosen to use a risk-reward of 1:1 as seen below and now we wait for the market to follow the analysis I have carried out, which is mainly that the market will obey the support range and bounce in the buy direction.
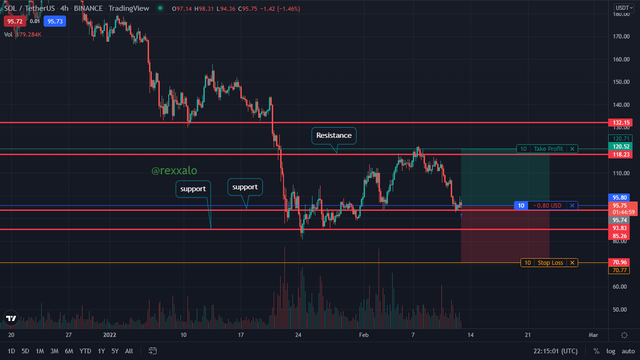
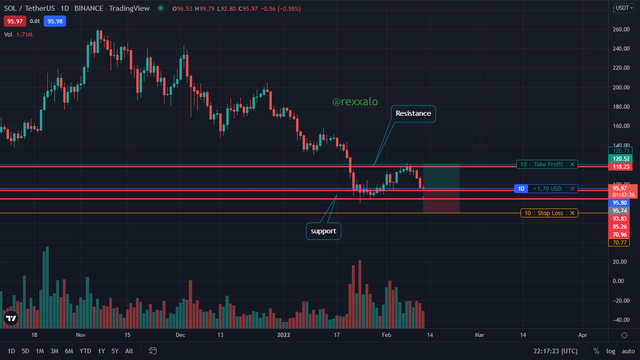
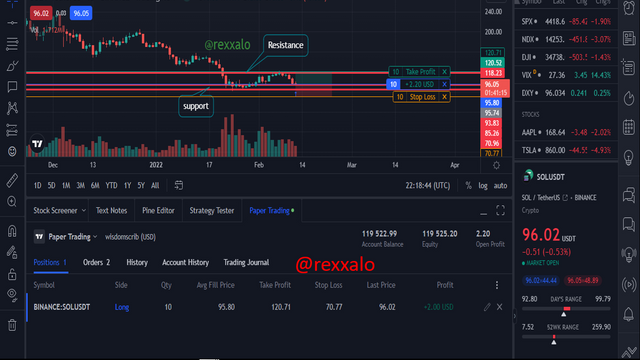
As expected, the price starts to bounce off the support line upwards, giving me close to $2.00 worth of profit as shown above.
Question 5
First of all, I would like to explain what candlestick patterns are so that the explanation of the hanging man and shooting star candles can be easily understood. Candlestick patterns are peculiar tools that form up on candlestick charts which can help a trader decipher market behaviour, price action and predict trend reversals effectively. They can occur on just one candle, or on multiple candles in succession, and are important to technical analysts.
They are formed depending on the state of the market, that is to say their formation is solely dependent on the buyer to seller relationship in the market, and they, therefore, show supply to demand in a diagrammatic expression, to help traders know what is really going on in the market.
The hanging man candlestick pattern is a rather popular pattern amongst technical analysts, this is because it is not too difficult to find it, especially in volatile markets, and it is very useful. It is shaped like a hammer as seen below and happens when the open price and the closing price are not too far apart, but a long shadow cast downwards is present.
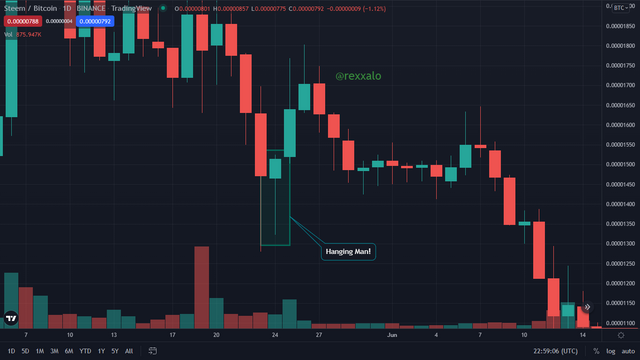
What happens in the market to cause this pattern?, well when the candlestick opened, the selling force of the market at the time was strong and pushed the price down, before the buyers present gained back strength and pushed the price of the commodity back up, causing the opening and closing price to be proximal to each other and also causing the long downwards shadow stick.
The hanging man candlestick pattern is a symbol of the bullish market regaining new strength after a bearish trend, and so it is used to spot a bearish trend reversal, but it could also work as a bullish trend reversal indicator if it appears at the top of a bullish run. However, one thing to keep in mind is that no candlestick pattern is 100% accurate and sometimes the trend reversal expected might not show up.
The shooting star candlestick pattern is another popular pattern amongst technical analysts also, it is also easy to find especially in volatile markets, and it is very useful. It is shaped like a hammer as seen below but an upside-down hammer that is being "dropped" and happens when the open price and the closing price are not too far apart, but a long shadow cast upwards is present.
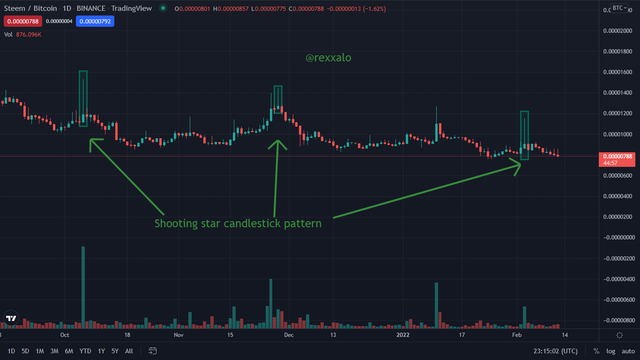
when the candlestick opened, the buying force of the market at the time was strong and pushed the price upwards, before the sellers present gained back strength and pushed the price of the commodity back down, causing the opening and closing price to be proximal to each other and also causing the long upwards shadow stick. It can be said that these two candlestick patterns are direct opposites of each other.
It is a symbol of the bearish market regaining new strength after a bullish trend, and so it is used to spot a bullish trend reversal, but it could also work as a bearish trend reversal indicator if it appears at the bottom of a bearish run. However, one thing to keep in mind is that no candlestick pattern is 100% accurate and sometimes the trend reversal expected might not show up.
CONCLUSION
Trading is fun in my opinion, and even though it is risky sometimes, the accumulation of knowledge and skills and the practice over time can definitely serve to increase a trade's experience and the chance of achieving trading success. We have talked extensively about fundamental analysis, and its uses.
we also looked into some indicators and talked comprehensively on technical analysis also, and I want to say it again that the best way to analyze the market is to analyze it technically and fundamentally, sometimes they might be contradicting each other, but other times, they help with trading accuracy in my opinion.
Special thanks to professor @pelon53 for the interesting and insightful class as always, I hope I was able to answer all questions satisfactorily, it's nice to be back to the steemit crypto academy, until we meet again, adios!