[Psychology of the Trend Cycle] - Crypto Academy / S6W4- Homework Post for @reminiscence01

Hi guys! Welcome to my task for professor @reminiscence01. This task is question based on the lesson on trend psychology given by professor @reminiscence01 and I will be answering the questions in different sections below.
Charles H. Dow is an individual who developed the famous Dow theory of price trends of asset mostly in the stock market but now this theory is used in carrying out trading analysis in every section of the financial markets including the cryptocurrency markets. This theory is based on understanding marjet trend I’m order to be trading the right direction at the right time instead of working against the market direction.
This is a financial theory which says that n asset will be in an uptrend if one of the averages (that is , the industrial or transportation averages) moves above the previous high and this is confirmed or followed a similar advancement in the other average. R example is the Dow Jones transportation average moves to above the previous high, the Dow Jones industrial average is expected to do so too subsequently.
This individual believed that the financial markets generally reacts due to the overall conditions of business in the general economy. This makes it such that analyzing the economic situation together with current market action will accurately gauge the price action on charts and give the trend of the market at a particular time period.
The Dow theory of trends has been developed over time such that it is not dependent on certain sectors that no more influence the market move as much as they did in the days of Dow.
The key highlights of the Dow theory are given below;
1). The Do theory is considered as a technical framework used to predict market trend such that one can tell if the market is in an uptrend, downtrend, or consolidation. This acknowledges an uptrend of the averages move above the previous high and conversely a downtrend when the averages moves below the previous low, while a rangeinf or consolidating market occurs when the averages oscillates between certain price range.
2). It predicated on the fact that the market always discounts everything in such a manner that is consistent with the efficient market hypothesis.
3). When applying this theory on trends, the different indices of the market must confirm each other in the aspects of the volume patterns and the price action until a market reversal occurs.
Therefore this theory briefly separates market trends into three moves such as the uptrend, downtrend and ranging markets. The aim of Dow was based on the believe that the activities of the market are built on the supply and demand mechanisms. Therefore analyzing the price will aid in knowing the market direction at a particular time.
This theory makes note of the following;
a). The markets on its own discounts everything
b). There are three main kind of primary trends; bull market, bear market, and secondary trends that may even go against the initial long term trend such that they constitute pullbacks or rallies.
c). Primary trends in the markets have three phases (in the bull market we have the accumulation phase, the big move and the excess phase while in the bear markets we have the distribution phase, public participation phase, and the panic phase).
d). Market indices must follow and confirm each other just like I explain on the averages above.
e). The price trend should be confirmed by the volume
f). A trend must remain on its course until a trend reversal takes place.
Like o explained on the section above we can see that the accumulation phase is a phase of the bull market and distribution is a phase in the bear market. In the market trend cycle, the market is either in a bullish market or a bearish market otherwise it will be ranging. At a time we can only have one of these market moves in our price chart. We can be in a bearish market and with due time the market changes to a bear market but as we know, the idea behind a traders work is to make profits from the market in either ways. We have also seen from the previous section that within a bull run we have pullbacks and rallies in a bear run. Traders take advantage of such situation and make much profits from the market.
At the beginning of an uptrend every trader should be rushing to open a long position and when they noticed that the price has moved way too high to an overbought, traders start to take profits from the market. On the other hand when traders see that the market is beginning a downtrend, they Suh into opening short positions and when the market feels oversold, traders start taking profits. This takes place in a cycle and repeats all the time. This scenario course what we call accumulation and distribution.
Due to that fact that the whales will always lead the marjet in a malicious way since the market is built such that one trader has to lose for the other to make profits. When the market show up a downtrend and retail traders goes in by opening short positions in other to folllow the market trend, the whales will wait for when the market has been oversold and they will enter the market and start taking profits from their short position ma by closing them. As they have a greater stake amount in the overall market, the closing of their positions at a particular trend starts to slow the volume and yields to the gains of the opposite market direction. Therefore when the whales take profits by closing their short positions, they start to take liquidity and begin to open bullish positions such that some retail traders begins to experience liquidation on their positions.
When the above scenario happens, the market start to see a bullish turn around as the retail traders enter the panic phase and close their short position in loses giving liquidity to the whales. When the whales continue to pump in huge amounts, the volume courses the trend to experience a complete bullish reversal and a new bull run begins by buyers entering the market more.
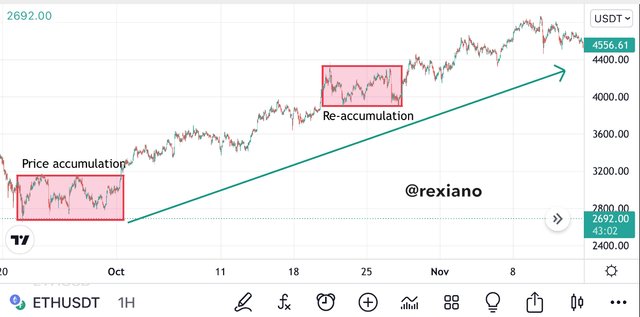
We can see from the screenshot above that the price entered an accumulation region after a bear run and then begins a bull run just after this region was broken to the upside. As more buyers came into the market, the buying pressure increased and so did the buying momentum. The minor retracements within ghe accumulation region signifies that the whales were taking profits at different points which led to small oscillations. As the accumulation phase progresses, we can see small lows and highs. The buyers use the small lows to buy into the market.
We see that there are certain points on the new bull run that looks like accumulation! These are re-accumulation areas where the buyers make more buys and wait for the trend continuation. I’m case the price goes below and breaks the re-accumulation region to the downside, we know that the uptrend has failed but if it continues to break this region only fr the upside then we have our trend continuation in progress.
For price distribution, the process is totally the opposite. This happens when the whales already bought the asset and led to an ongoing uptrend such that they take profits at overbought regions and start to close their long positions. This slows down the overall bull market and we have the volume reduced while the price starts to drop. During this period the retail traders experience some level of panic after being greedy. This causes reatail traders to sell off in loses and provide liquidity to the whales. At this point we see a sideways market like that of an accumulation but this time around at the top of the market. The price now breaks this distribution region and moves downward into a bear market.
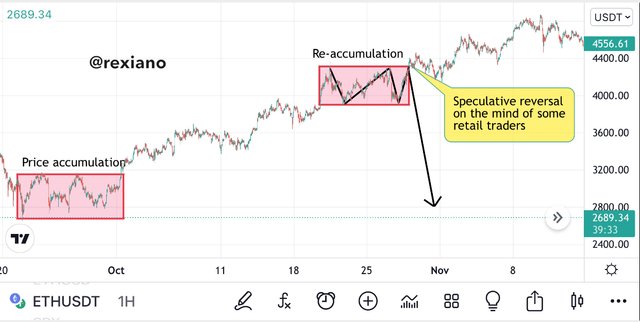
We see from my screenshot that we had a bull market and at one point the market started ranging at the top of the trend causing panic. At the end of that region we see how the price broke through the downside providing liquidity to the whales and beginning a bear market.
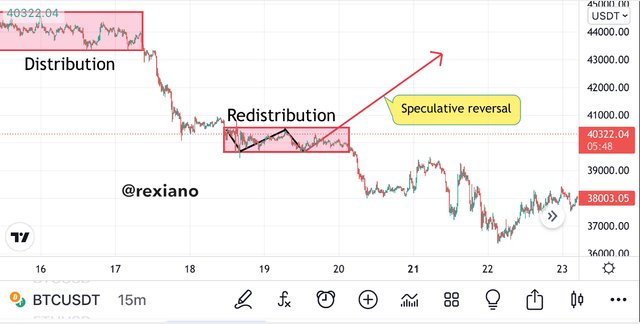
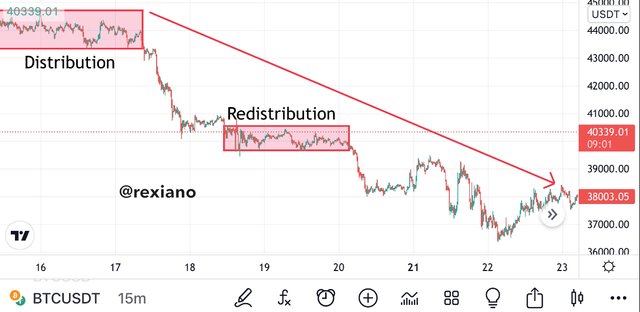
We can see the redistribution region on this second screenshot of the distribution section. At this point retail traders starts to exercise greed thinking the price will make a reversal and begins the former bull run again not knowing that it’s a redistribution phase of the market that will only take prices down the more.
Price accumulation and distribution can be well understood if the trader doesn’t work with much emotions in the market. Executing when necessary or reducing the position size when you sense this activities such as the redistribution or re-accumulation can be a great means of avoiding liquidation. It should be known that the prices of assets in the market will always get manipulation from the whales and the retail trader who is clever enough will always notices and act with the distribution and accumulation phases in order to stay profitable or reduce loses.
As I de tidied by the Dow theory of trend psychology, there are three main trend types that will always occur in the market. Having knowledge of these trends seperate Lu will give a trader an added advantage to understanding when a trend is having strong momentum and when the strength of a trend is getting weak and giving way for another trend. Just seeing the price chart you can be able to determine the trend of the market provided you have knowledge of these different trends. The indicator tools can only help you identify when and where to make entry and exits into and from the certain market trend. Therefore these indicators confirm the trend after a trader already sees it.
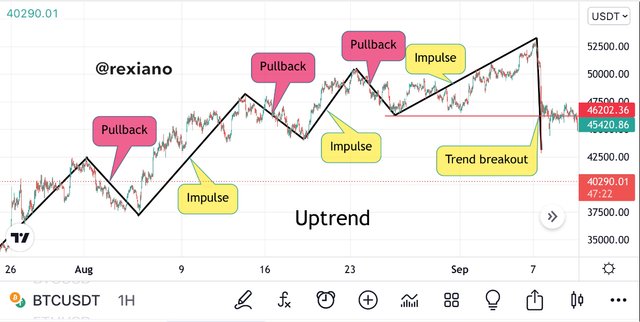
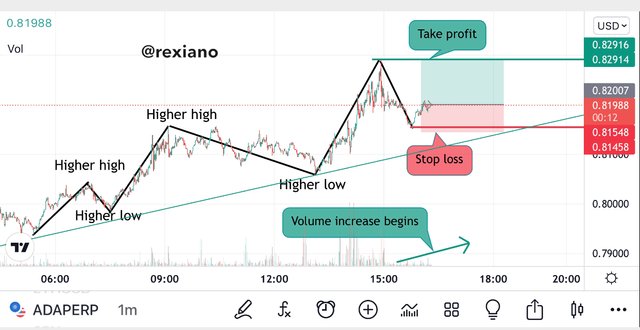
The uptrend or bullish market occurs when the market trades such that it forms a series of higher highs and higher lows. This gives way for breaking new highs all the time and making more upward moves even though some pullbacks are seen. This type of marjet is controlled by the bears (buyers).
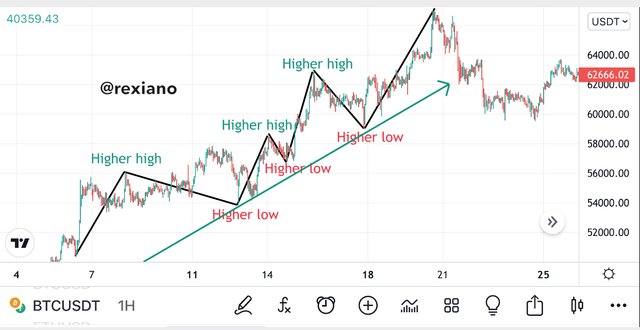
New can see the price trading with higher highs and higher lows on the above screenshot. From this we can draw a line linking the higher lows and call it our trendline such that until this line is broken, we will always remain in an uptrend.
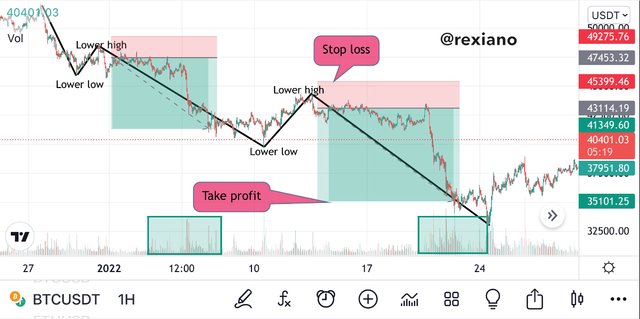
For a downtrend, the market remains in this side of the price keeps forming lower lows and lower highs such that we can draw a line connecting the lower highs and call it our trendline. Unless this line is broken, we will remain in a downtrend. This type of market is controlled by the bears (sellers). This screenshot below describes what a bear market is like.
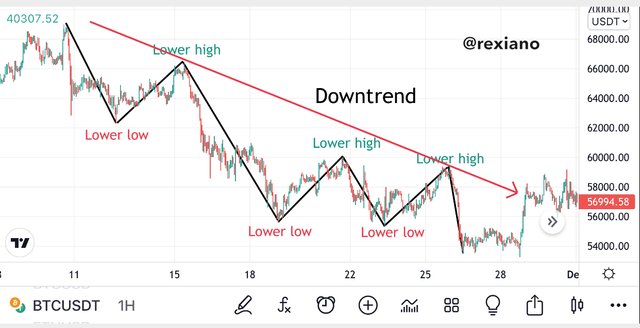
As seen from the screenshot above the price makes lower lows and lower highs for some time. This is the functioning of a downtrend until the trend is broken and a reversal takes place.
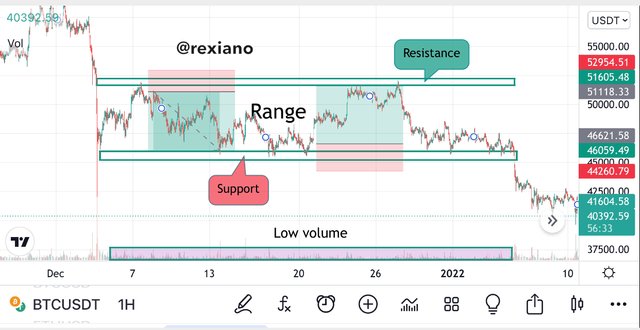
The ranging market or consolidation can take place in the accumulation or distribution areas. This occurs when the price of an asset trades within a certain range and forms strong support and resistance such that the asset trades to the resistance and bounces back to the bottom until it hits the support and turn around again heading for the resistance. This continues until the bulls or bears take over the market and lead a breakout such that the ranging region is broken and we have either bull or bear market trend.
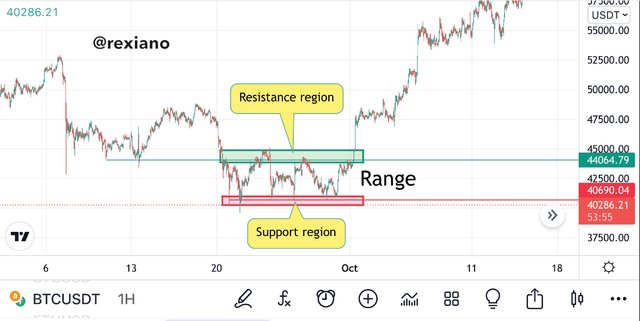
We can see how the above screenshot confirms the explanation of a ranging market.
We should note that during the uptrend or downtrend the can be sub marjet loves such as the impulsive trend which is a trend that follows the direction of the main trend and a retracement (pullbacks) which is moving against the original trend. This sometimes gives chance for traders to increase their position or have opportunities to enter the market if they missed it. This happens because some traders took profits and the volume reduced while taking the price to the opposite side then when traders make more entries it gets back on track.
As indicated on the Dow theory of trends that the volume is of significance to the overall process, I will be talking about the importance of the volume indicator when working with trends. The action of the trading volume of an asset is the representation of what is going on with the amount of that asset that enters or leave the market.
The market discounts every action and so the factors responsible for these actions include the volume of the asset that leaves or enters the market at different times. The volume has a direct implication with the supply and demand and trades a good relationship with the different market phases. When the market trades in a particular direction, the volume to that respect will increase but if the asset trades in an accumulation or a distribution area, the trading volume reduces. This is because at the distribution and accumulation areas we have traders taking profits or adding liquidity. Therefore if we have an impulsive move to the uptrend/downtrend we are going to have high volumes of the asset.
The following screenshots shows the three different trends and their reactions with the trading volume of an asset. We can see how the asset trades with a high volume for both uptrend and downtrend but tends to trade with a smaller volume during the ranging phase.
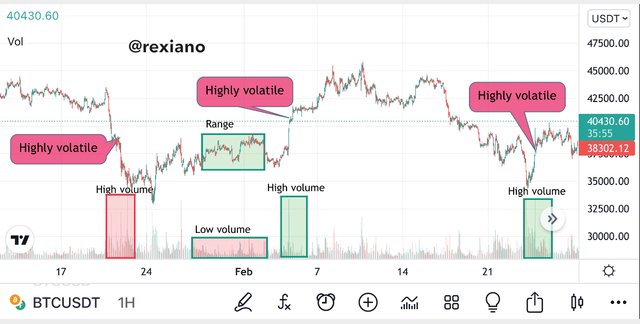
The high volume we see from the uptrend indicates higher buying pressure while that of the downtrend signifies higher selling pressure. When the buying and selling pressures are almost equal, we have a ranging market and at this point the volume tends to be small as seen above.
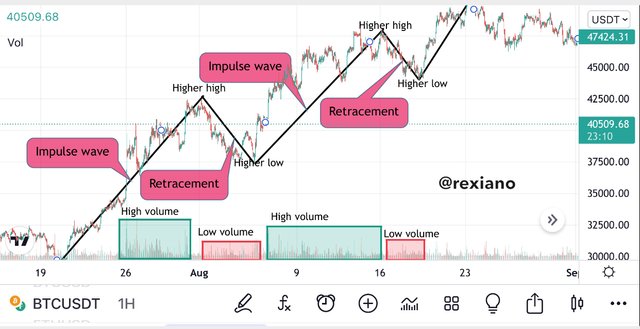
From the above screenshot we can see how the retracement has lower trading volume than our impulse wave and this is to say that the retracement has less momentum compared to the impulse (the main trend). For the specific example on the screenshot above we see that the overall trend is bullish and we need to have a higher bullish momentum. If at one point the retracement volume is too high, we can think of a possible reversal about to happen and so wait for the retracement (pullback) to break the previous low to confirm.
In this exercise I will show how and when to place a trade using our technique as learnt from this lesson. We’ll be able to see how to make entries and how to exit all the three phases of the market.
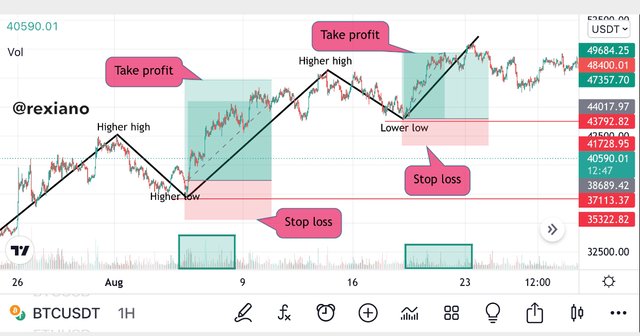
In a bull market structure, we normally have the asset making higher highs and higher lows continuously such that until this move is broken we will stay on the bull marke. To carry out the trading criteria on the bull market we have to follow the three rules below.
1). Make sure the rules of an uptrend is in execution such that we have the higher highs and higher lows. The trading volume must be high on the bullish impulse.
2). Open a long position after the retracement must have happened and gave way for the formation of a bullish candle that signifies a strong bullish momentum. You can still use any of the candlestick patterns that may apply in such situations depending on what the chart brings to you.
3). The exit criteria is such that the stop loss is set below the last candle that formed on the base of the retracement. The take profit can be positioned at a 1:1 or 1:2 risk/reward ratio but I always prefer the 1:2 risk reward ratio.
During a war market we have lower lows and lower highs such that we can draw a trendline linking the highs. This activity brings an overal high trading volume at the impulses. We take note of the rules below to place trades on a bear market using this trading criteria.
1). The first thing is to make sure the asset is forming lower lows and lower highs which has been confirmed with the trading volume to be in an overal downtrend.
2).We wait for the asset to trade into a retracement with a lower high. When the asset starts to trade back into our bear market we now wait for an impulsive bear candle to form or use any candlestick pattern good at this point to make entry by opening a short position.
3).The exit criteria is such that the stop loss is set just above the last candlestick during the retracement and we also set the take profit at a 1:2 risk/reward ratio.
The sideways market or consolidation is such that the prices already forms a a certain support and resistance between which the asset trades. Here the price hitting the resistance and bouncing back to the support areas and rebound again until the support/resistance is broken eventually. The following rules can apply in trading ranging markets.
1). Wait for the price to hit the support or resistance level before placing a trade to the opposite side.
2). Make sure the price does not break the support or resistance before placing a ranging trade. When there’s a breakout, the trades are no more in a ranging market criteria.
3).For a long position, we set the stop loss just below the support level and the take profit should be just before the resistance level.
4). For a short position, the stop loss is set just above the resistance level and the take profit should be set just before the support level.
Before placing any order I’m the ranging market we have to make sure that the asset is not trading into a breakout. We use the candlestick patterns to understand when the trend is reversing into the range zone so that we can place our order then.
I will carry out the trend based analysis and place two trades such that we will have a buy and a sell trade depending on the market structure.
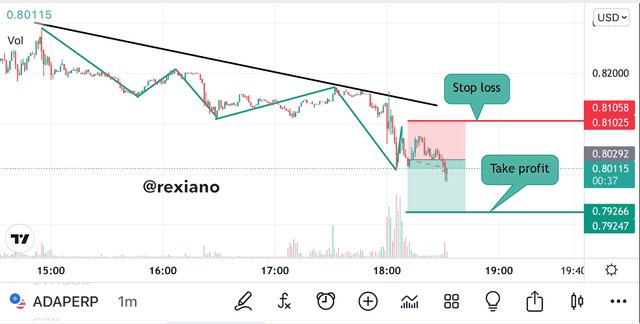
For the buy trade I analyzed the ADAUSDT trading pair on tradingview platform as seen on the screenshot below. The asset was trading in an uptrend and after the pullback I made an entry for a long position. At the end of the trade the price trades and hit my stop loss indicating an end of the supposed uptrend.
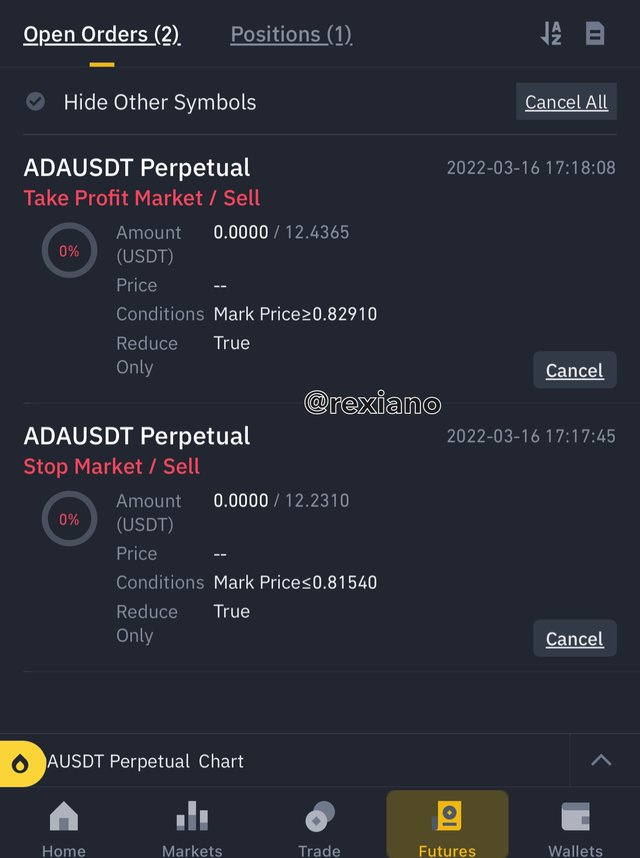
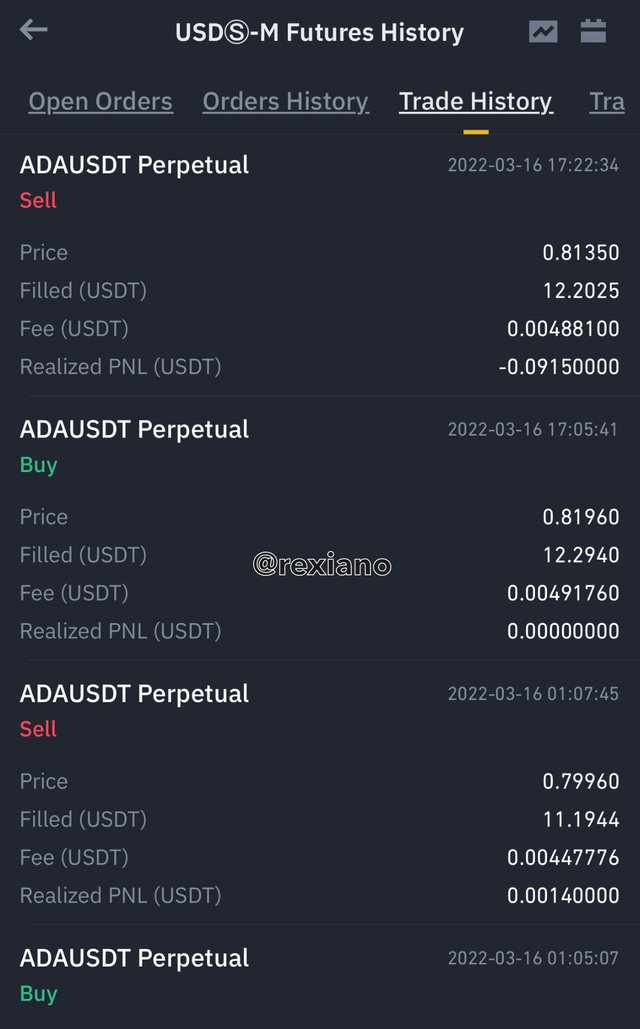
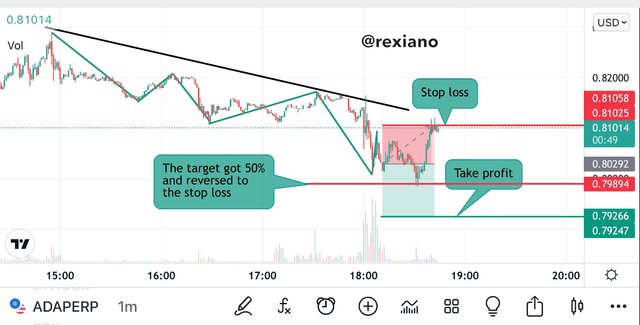
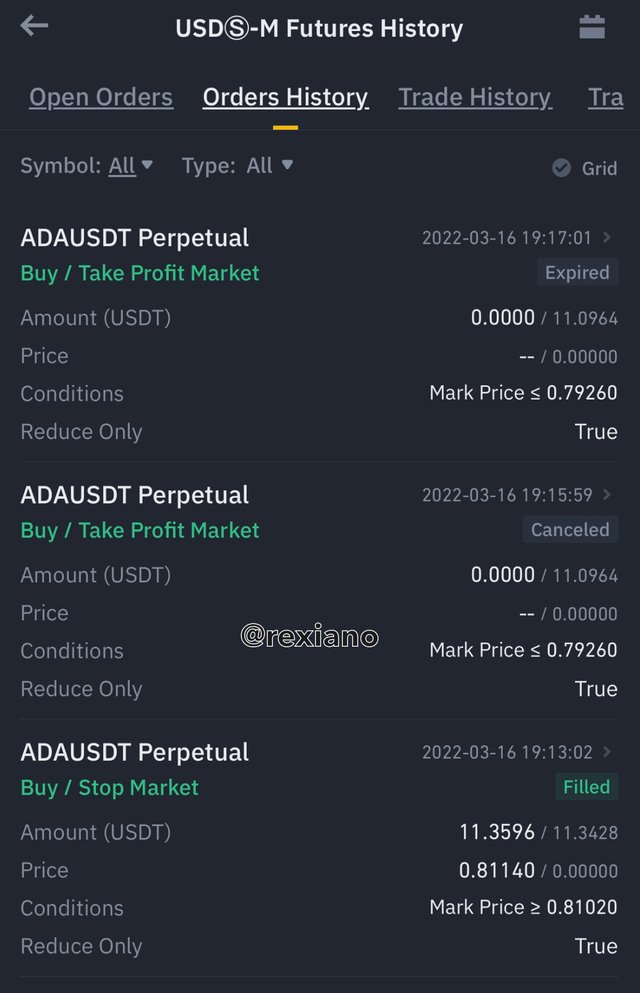
For the sell trade I still maintained the same asset since the evidence of the above failed trade indicated that the uptrend had lost its momentum and a possible downtrend is in progress. I did the analysis as seen below and I made an entry. At the end of the trade, the price trades to more than 50% of the profits zone and later reversed into my stop loss and hit the stop loss price just above the previous high. If I had set up a 50% and 100% seperate take profits levels like the trade would’ve been half successful and half failure.
I learnt from the two positions I opened that it’s always good to set take profits in small scales so that one can not lost totally. Secondly when I looked into the chart I found out that the reason for the failure of the first trade is because the last high was at a very strong resistance significant from higher timeframes and this is why the price had to retrace much harder and retest the resistance which led to the failure since the bears couldn’t maintain pressure to pull it off and so the bears took over at that point.
Market trends marks an important aspect of trading and understanding this concept is an addition to a trader. When you understand trends and the psychology behind trends we see that trading becomes very simple to make it successful.
Carrying trading activities based on these criteria in addition to other trend following indicators and reversal indicator tools such as the Fibonacci retracement will make trading more profitable. Taking note of the are small activities seen on the candlestick chart such as the candlestick patterns and support and resistance levels will aid more in the perfection of this trading analysis technique.
Hello @rexiano , I’m glad you participated in the 4th week Season 6 at the Steemit Crypto Academy. Your grades in this Homework task are as follows:
Recommendation / Feedback:
You seems to have written some part of your work (Dows Theory) from an external source https://www.investopedia.com/terms/d/dowtheory.asp . I found some similarities which i couldn't come to a conclusion. But i will keep an eye on your future submissions.
Thank you for participating in this homework task.
Thanks for the remark sir.
Concerning the point on
I thought doing additional research to compliment the lesson was a great idea but I’m sorry if it appears to be direct paraphrase.
Thanks for understanding