What's Happening in the Crypto Market? - A Technical Review of STEEM/USD.
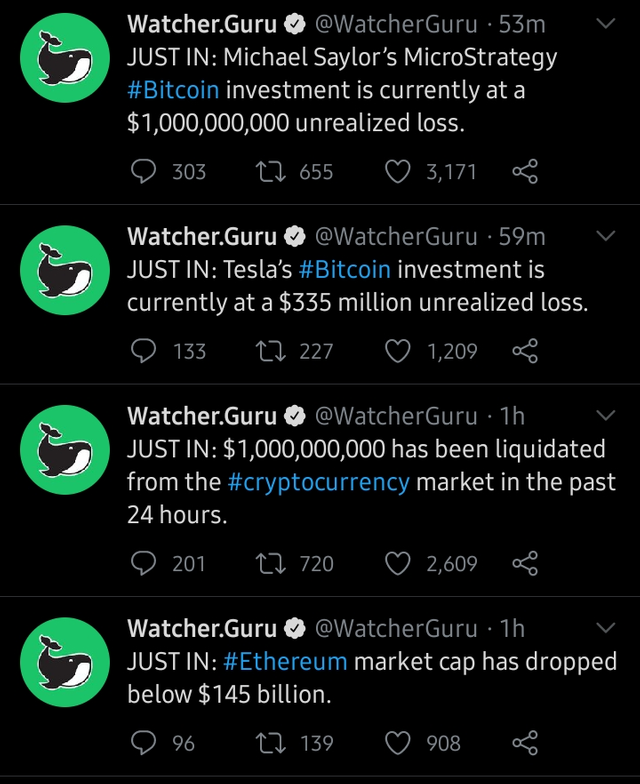
Hello everyone, I trust everyone is doing fine today. Well, it's understandable if you are not fine due to the current situation of the crypto market. Everyone is taking the hit of the dip with more than $1billion liquidated in the last 24hours. Crypto platforms like Block.fi and crypto.com has started laying off their workers as they are deeply affected by this dip. Yes, I was expecting the dip but not this much.
So many companies have lost millions of dollars in their investments due to this dip. Well, as I have always said in my previous analysis, this is the bear market which is also part of the market cycle. If you have been following my previous analysis, I have always started with how strong the bear market is with high selling pressures.
From the higher timeframe perspective, the overall structure is bearish with no sign of bullish reversal. The crypto market is the only affected market. The US30 is down by 8% and you know what that means if you trade US30. All this dip is caused by the high inflation rate and if this continues, we might see a further dip in the market. Right now BTC is heading to $19k and I don't think there's any support on its way.
Let's look at how the market has reacted to this current dip. Is there any possible soon? Let's find out from the technical analysis.
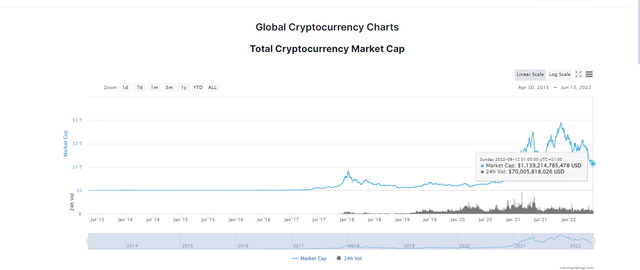
Looking at the global cryptocurrency market, we can see that the total market cap at the time of writing this article is $1.13 trillion. After the market cap all-time high in November 2021, the crypto market has lost $1.77 trillion in its market cap which is more than 60%. The current 24hr trading volume across all platforms is $145 billion.
Recap of Previous Analysis
In this section, we will be using Steem/USD as usual for our analysis. We will be looking at how price has reacted to our previous analysis.
In the previous analysis, we predicted the two possible price movements after price has seen in a range at the previous support now turned resistance. We were expecting a breakout to either upward or downward depending on the buying and selling pressures. Now let's look at the recent market structure to see what has happened.
STEEM/USD Technical Analysis
In this section, the multi-timeframe of STEEM/USD will be carried out on the Weekly and Daily charts. These timeframes are selected because we are looking at the direction of the price and not an entry opportunity to trade.
Steem/USD Weekly Chart
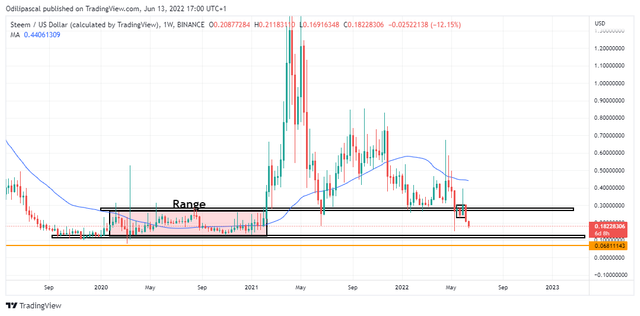
Looking at the weekly chart above, it is no doubt that price has rejected the broken support which is now turned resistance. Two weeks ago, we noticed a false breakout above the broken support. A few days later, price came back down to normal trading below the broken support.
Now we can see that the bearish movement is strong. As long as the inflation keeps rising and BTC keeps going down, Steem price will also react to it. If this happens, the next stop for Steem is the support level at $0.12. After then, we can expect a price reversal.
Now let's analyze this on the daily chart.
Steem/USD Daily Chart
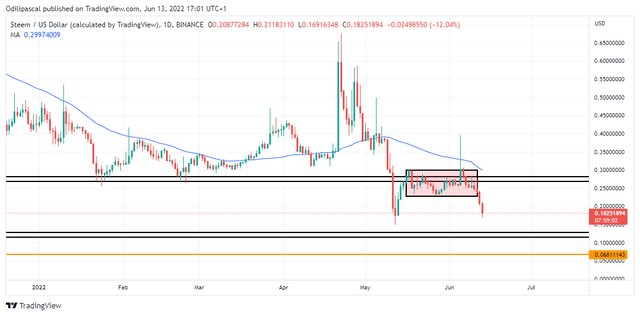
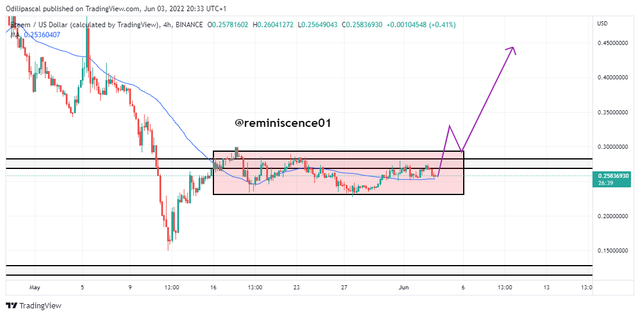
From the daily chart, the breakout is clear from the range as predicted in the previous analysis. Further downfall is expected with the possible target at the $0.12 support level. We just have to be careful with our investment at this point. I suggest waiting for price to show signs of recovery before making any investment decision.
Let's look at the possible price movement for Steem. Where will price go next?
Predicting the Next Direction of STEEM/USD
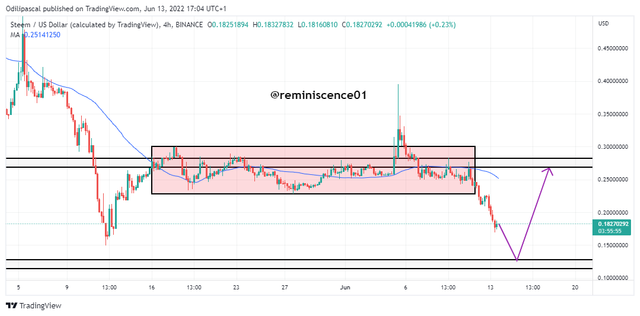
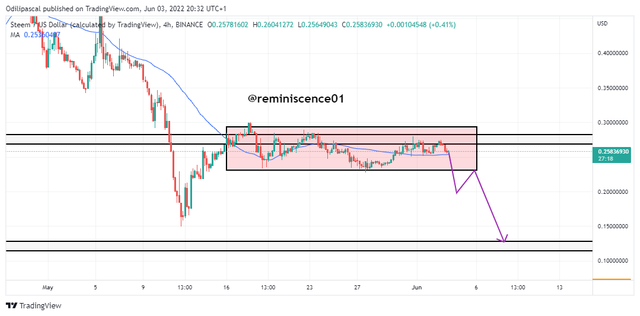
Looking at the chart above, price has broken out of the range showing a clear rejection of the resistance at $0.27. Now we will be expecting price to test the support level at $0.12 before reversal.
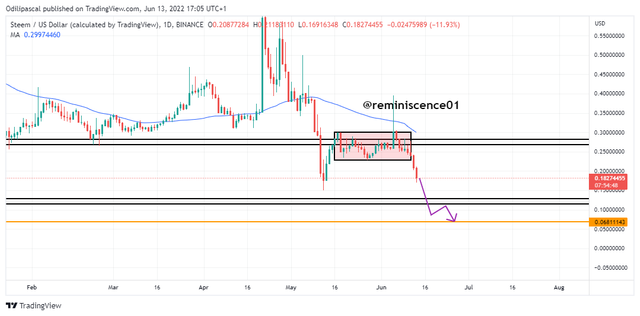
Another possible price movement is something we will never wish to happen to the price of Steem. But of course, it depends on the entire market condition. Price will continue trending in a direction breaking support and resistance levels as long as the buying and selling pressures remain strong. If this bear market continues with this momentum, it is no doubt that Steem might retest its lowest low since 2017.
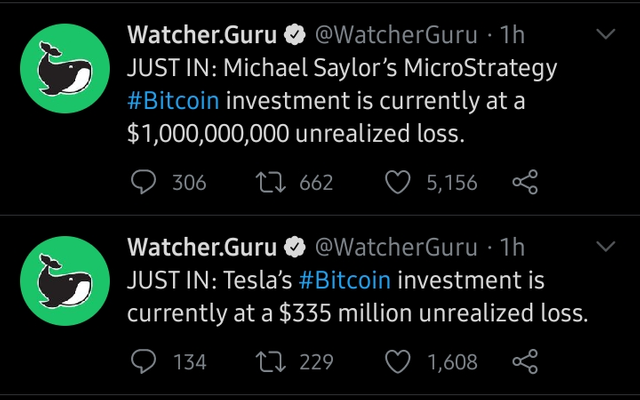
These are the worst moments in the life of crypto investors. So many investors have lost a lot of money in the market. Top cryptocurrency investors like Tesla and Michael Saylor's Bitcoin Strategy have lost more than $1 billion since Bitcoin's all-time high.
This is no joke, invest wisely and manage proper risk management. If you are still holding, then hold strong and don't panic sell your assets at a loss. The market will recover and we will see greens again.
Note: This analysis is based on my personal opinion and knowledge. This is for educational purposes and not a piece of investment advice. Please do your own research and invest what you can afford to lose. The crypto market is highly volatile and risky.
Cc: @reminiscence01
Thank you for sharing this useful post, at this point we just have to be careful with our investments due to the crypto market's excessive volatility.
Quite educating. I hope it rises soonest
Thank you. We are looking forward to the bullish reversal of Steem.
Thank you @ozenozge.
Hmmmm this is really serious and it is also affecting daily living, thank you for this update let's be hopeful that crypto price doesn't get more down because it will be disastrous, we pray it turns green and we all rejoice.