Trading Strategy with Median Indicator - Steemit Crypto Academy |S6W4| - Homework Post for Professor @abdu.navi03

Hello Steemians, I welcome you all to the 4th week of season 6 in the Steemit Crypto Academy. This week, we will be looking at another trading strategy with the Median Indicator. Indicators are important technical analysis tools in the financial market today. There are so many categories on indicators and we will be looking at one of them today. Thanks to the lesson by professor @abdu.navi03 on Median Indicator. Let's understand how this indicator works and we can generate trading signals from their indicator.

Understanding Median Indicator
Technical indicators are important technical analysis tools in the market a trader can utilize in making a good trading decision in the market. The median indicator is a trend-based indicator like the moving average, Heikin Ashi, etc for identifying trends in the market. The median indicator is slightly different from other trend-based indicators because the indicator measures volatility in the market using the channel created using an ATR from the median line.
The ATR of the median line is plotted above and below the median line which helps to determine the volatility in price. The median lines are compared to an EMA of the same length. The difference between the median line and the EMA of the same length forms a cloud on the indicator which determines bullish and bearish trends. This cloud changes from purple to green which serves as signal information to determine bullish and bearish markets.
Also, a bullish signal is identified with a green cloud when the median line crosses above the EMA. The bearish signal is identified with a purple cloud when the median line crosses below the EMA of the same length.
Parameters and Calculations of Median Indicator
Indicators are gotten from mathematical models of price data points like the closing price, opening price, highs, and lows over a period. For the Median indicator, it utilizes the ATR and a multiplier to plot the upper and lower band above and below the median line. The calculation is shown below.
- Median length = This is the number of data points put into consideration when calculating the median. This value is 3 by default.
- ATR = This represents the period put into consideration when calculating the ATR of the median. This is 14 by default.
- ATR Multiplier = The value ATR is multiplied by the ATR in the formation of the upper and lower bands. This is 2 by default.
Upper band = Median length + (2ATR)
Lower band = Median length - (2ATR)
These values above are the default values of the indicator. A trader can modify these settings according to their trading style.
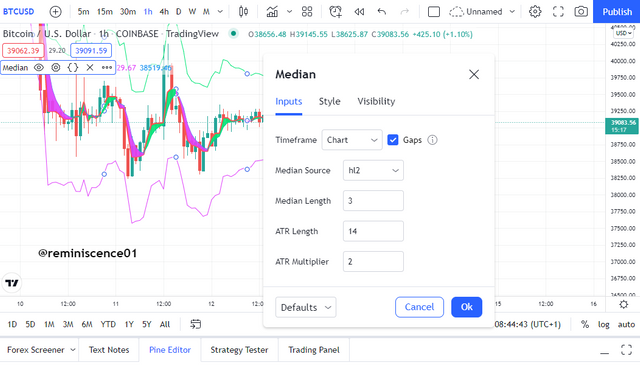
From the chart above, we have the parameters of the median indicator which I have explained in the calculation. The median length and the ATR value are very important and sensitive parameters of the indicators which determine the signal given by the indicator. Wrong inputs of these values can alter the smoothing of the indicator and thus give false signals.
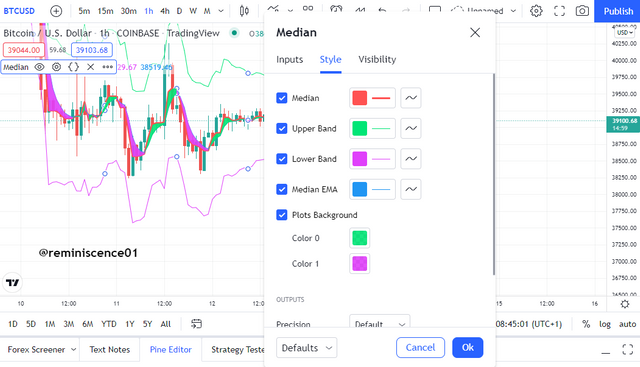
Here, we have the style settings where the appearance of the indicator can be modified. This section is not important in the efficiency of the indicator. This depends on a trader's trading styles as discussed above.
Uptrend from Median Indicator
The median indicator is a trend-based indicator like the moving average. The difference between the median line and an EMA of the same length forms a cloud that determines bullish and bearish trends. The cloud is green when the median line is above the EMA which signals an uptrend trend. When this happens, a trader can look for a bullish position in the market. An example of shown below.
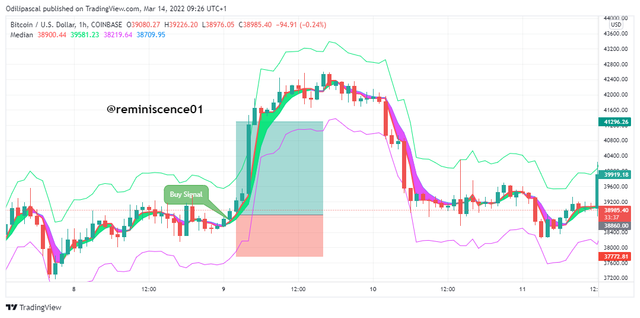
From the chart above, we can see how the indicator cloud changed from purple to green which signifies a change from a bearish to a bullish trend. Here a bullish position can be executed.
Downtrend from Median Indicator
The difference between the median indicator and an EMA of the same length forms a cloud that determines bullish and bearish trends. The cloud is purple when the median line is below the EMA which signifies a downtrend. When this occurs in the market, a trader can look to open a sell position to capitalize on the new trend. An example is shown below.
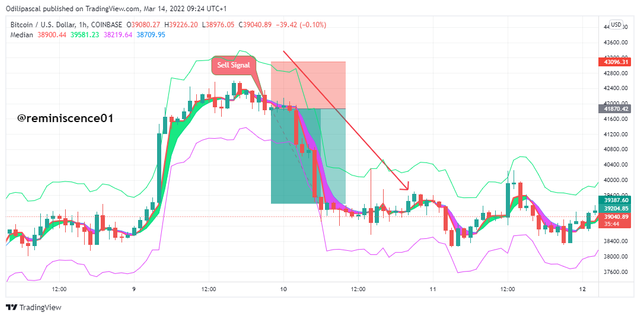
From the chart above, we can see how they changed from green to purple after a bullish trend. This signifies a trend reversal from bullish to bearish and an opportunity to open a sell position.
Identifying Fake signals with Median Indicator
Indicators are not 100% accurate. They are prone to fake signals as they utilize historical price data points. The median indicator is not an exception as the indicator can also give fake signals. Trend-based indicators like the moving average lag behind price. Indicators work best when combined with other technical indicators to filter out false signals. In this section, I will be combining the RSI indicator to filter out the false signal from the median indicator.
The RSI is a volatility-based indicator that signals when price is overbought and oversold. An RSI above 70 signals a bearish trend reversal while an RSI below 30 signals a bullish trend reversal.
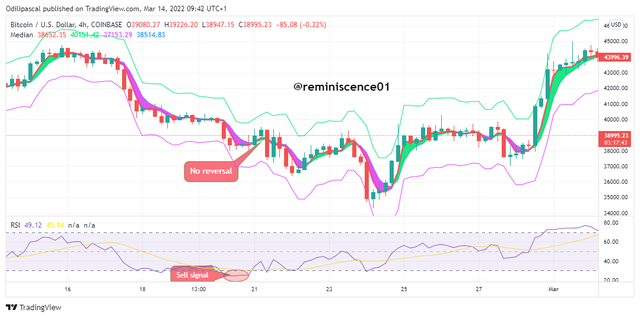
From the chart above, we can see the RSI below 30 which signals a bullish reversal. Meanwhile, the median indicator is still purple and hasn't shown any sign of bullish reversal. To be on a safe side, you have to be patient for both indicators to give a bullish signal before you open a position.
Opening a Demo Trade using the Median Indicator
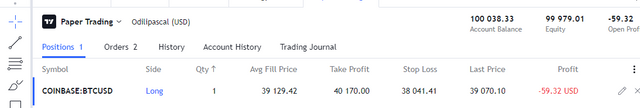
In this section, I will be opening a demo trade position from the signal on the Median indicator. The analysis will be carried out on Tradingview while the trade execution will be carried out using Tradingview paper trading.
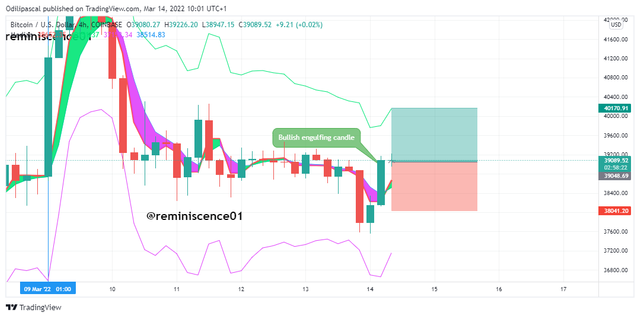
Buy Trade on BTC/USD
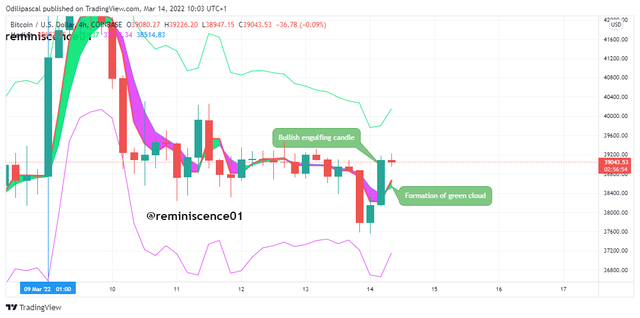
Looking at the chart of BTC/USD, I noticed price was in a downtrend as indicated on the median indicator with a purple cloud. After a while, the cloud changed from purple to green with a bullish engulfing candlestick pattern. This signals a trend reversal signal and an opportunity to open a buy position. I executed a buy position on BTC/USD with a 1:1 risk-reward ratio.
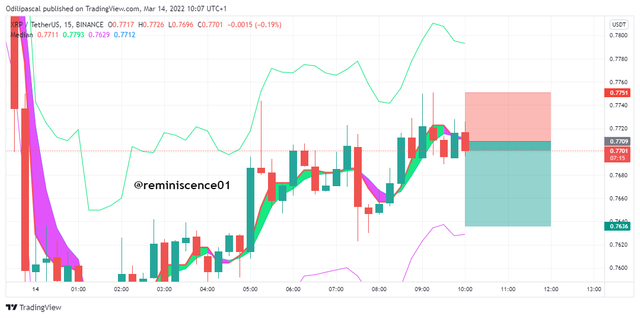
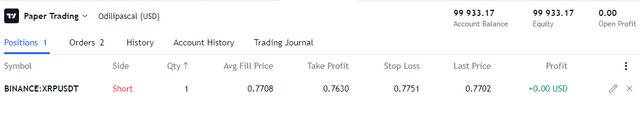
Sell Trade on XRP/USD
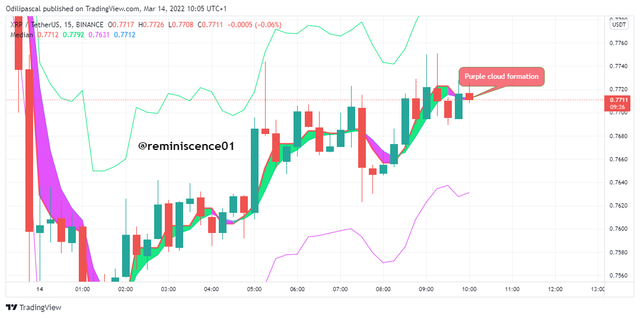
Looking at XRP/USD chart, I noticed a trend reversal as the median cloud changed from green to purple. The change signals a trend reversal from bullish to bearish and an opportunity to open a sell position. I opened a sell position with a 1:1 risk-reward ratio.
Conclusion
In this study, we have discussed the median indicator and also how we can obtain useful trading signals using the median indicator. The indicator is a trend-based indicator that can signal a change in trend from bullish to bearish as the median cloud changes from green to purple.
Indicators are not always 100% accurate. It is required that we combine indicators with other technical analysis tools to filter out false signals. We have combined the RSI with the median indicator to generate accurate signals from the market.
Thank you professor @abdu.navi03 for this amazing lesson on Median indicator.