STEEM/USD Technical Outlook - 21st February, 2022 | Club75 Double Dolphin Soon

Hello Steemians, welcome to the weekly cryptocurrency outlook with emphasis laid on STEEM coin. The crypto market has been in a decline in the past few days and this can be seen in line with our prediction. Before we continue this analysis, let's look at our prediction in last week's review. The link to the last weekly outlook is seen below.
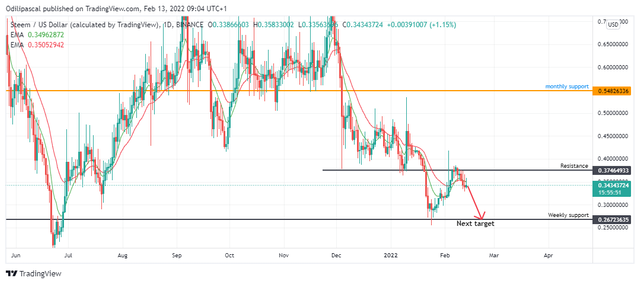
The chart above shows our expectations of price and possible price movements. After price retested the support at $0.26, we expected price to retest the resistance level at $0.37 before continuing its downtrend. In the last week's review, we predicted price to retest the support level again at $0.26 if price is rejected at the resistance. You can see the prediction on the chart above using a red arrow.
Now let's look at the recent situation in the market. Before we go into this, let us look at the Global crypto market cap.
Global Crypto Market Cap
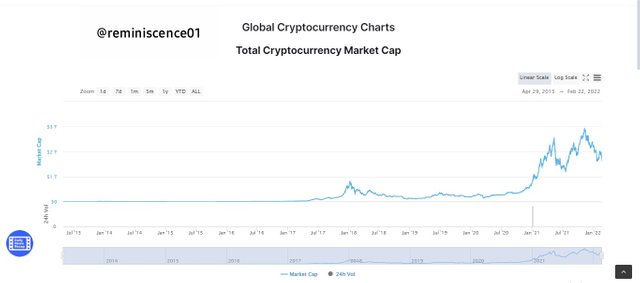
From the chart above, we can notice a decline in the global crypto market cap over the past week. The global market cap of the crypto market is currently $1.65 trillion. The crypto market jas seen a decline of -$250 billion in the last week. This effect can be seen in the price of BTC from $42.6k in the last analysis to $36.6k at the time of writing this post.
STEEM Technical Information
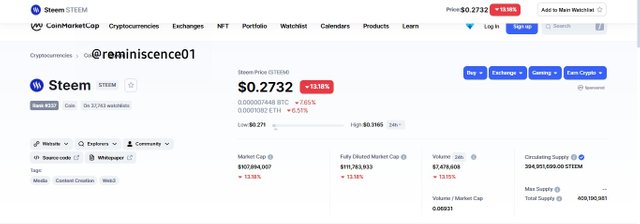
From the screenshot above, we can see a decline in both the price, market cap, trading volume of STEEM. The crypto market is in a continuous decline at the moment. STEEM is currently ranked #337 according to market cap with a market cap of $107.8 billion. This is a -$27 million in the past week. The circulating supply is currently 394.95 million and a 24hr trading volume of $7.3 million.
STEEM/USD Analysis
Weekly Chart
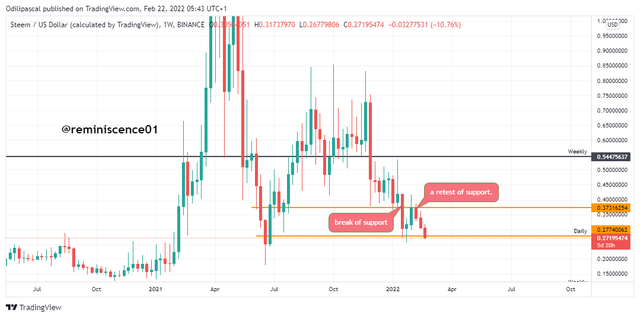
From the weekly chart above, price have correctly followed a market structure pattern with a break and retest of a support level. Last two weeks, we analyzed when price retested the support level at $0.27. After that we expected price to retest the broken support now turned resistance before making its way down. Price has correctly followed this pattern and this shows the extent of bearish pressure in the market. Now let's look at the situation on the daily chart.
Dialy Chart
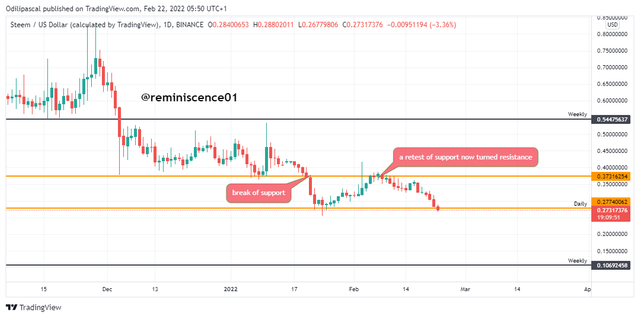
Looking at the Daily chart, the bearish trend is pretty clear with a bearish market structure of lower lows and lower highs. There's is high selling pressure on STEEM currently. This bear market is not only applicable to STEEM but the rest of the crypto market.
Let's look at the possible price movement of STEEM in the market today.
Future Price Prediction
1st case Scenario
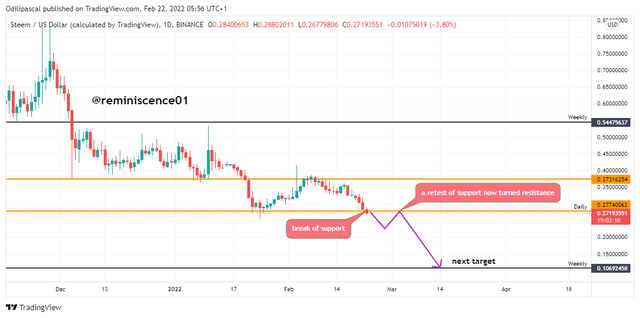
Looking at the chart above, STEEM is currently trying to break the support below $0.27. This confirmation is not clear yet until the close of the current daily candlestick. If the breakout happens, it will trigger more selling pressures in the market as a result of the emotions and psychology of traders. We will be expecting a break and retest of the support before price decline to the nearest support at $0.1069.
2nd Case Scenario
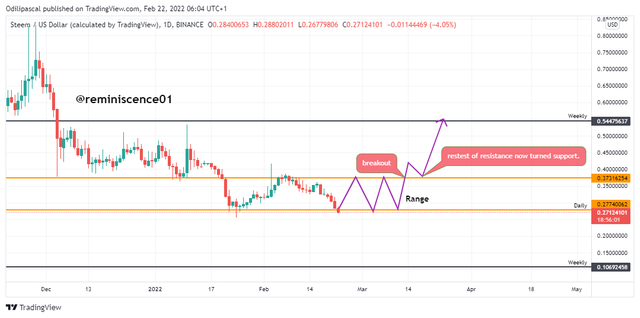
Another possible scenario is for price to enter an accumulation phase. If the support holds price, we can experience a ranging market as price will bounce off support and resistance levels. If the buying pressure is higher than the selling pressure, we can see a bullish breakout of price above the resistance level at $0.38.
We will be back again next week to update you on the current price situation of STEEM/USD. This analysis is mainly focused on the technical information on STEEM. As a crypto investor, it is required that you combine the technical information with fundamental factors that affect STEEM price to make a good investment decision.
Disclaimer: This analysis is not a piece of financial advice, rather it is made for just educational purposes to help you understand the price reactions to make your own analysis. Investing in cryptocurrency is very risky and it is advisable to consult a professional before making any investment decision. Also, ensure you implement proper risk management on any investment decisions you make in the market
Cc:
Your post has been successfully curated by our team through @nane15. Thank you for your committed efforts, we invite you to do more and continue to post high-quality posts for a chance to win a valuable upvote from our curating team and why not be selected for an additional upvote later this week in our Top Seven.
Note: Always use the tag #fbcrypto to quickly access your post.
Let's hold thumbs for that break of the support line
I doubt it will break the support. we already have a hammer candlestick pattern formed at the support. This is price reversal pattern and we can see price is making its way up to the resistance.
Would love to buy Steem at a lower price