Onchain Metrics Part-3 (GIOM, Adjusted Large Transaction Volume)- Steemit Crypto Academy- S5W5- Homework Post for @sapwood

Hello Steemians, I hope you all are doing fine? This week prof @sapwood continued on the on-chain metrics series and focused on GIOM and Large Transaction Volume. The lesson was educative and enlightening, and I will be doing the homework task from the study.

What do you mean by Global In/Out of the Money? How is a cluster formed? Explain ITM, ATM OTM, etc with examples?

Global In/Out Of The Money
Global In/Out of the Money is an on-chain metrics that uses clusters of addresses that bought the crypto asset at a particular price range to ascertain if an address is in the money or out of the money (i.e. if the address is making a profit or losing money).
The GIOM shows the relationship of the asset's current price with the cluster to determine if the cluster is in profit or not and does not necessarily tell if an individual address is in profit or not. The clusters also act as support and resistance levels for the asset.
The clusters are formed by considering the price at which an asset was bought and held in an address. The clusters are in ranges and contain information that includes the cluster price range (Minimum price and Maximum price), number of addresses on the cluster, the volume, and average price.
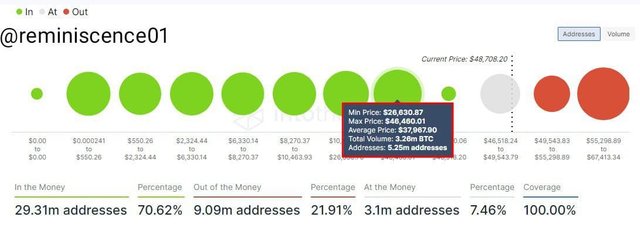
The clusters are categories into three; namely, In the Money, At the Moneyand Out of the Money. These categories of clusters tell us if the cluster is profiting or not.
The image above showed that 29.31m addresses were in the money, and they accounted for 70.62% of the total addresses of Bitcoin. 9.09m addresses were out of the money accounting for 21.92%, and 3,1m addresses were at the money and accounted for 7.46% of the total addresses.
In The Money ITM
ITM is a cluster category whereby the asset's current price is higher than the price range of the cluster. The cluster is said to be in the money because the asset held in that cluster of addresses was bought below the asset's current price. Hence, the cluster or addresses within that price range is in profitand are given the color green. ITM clusters act as a support zone for the asset.

The highlighted cluster has a price range of $7,437.72 - $10,043.38 with an average price of 8,763.15, total volume of 1.45m BTC, and 4.45m addresses. The current price of the asset is $48,708.20, meaning that the selected cluster is in the money as the current price is higher than the selected cluster price range.
At The Money ATM
ATM is a cluster category whereby the asset's current price is within the price range of the cluster. The cluster is said to be at the money because the asset held in that cluster of addresses was bought at a similar price to the asset's current price. Hence, the cluster or addresses within that price range is neither in profit nor loss, and it's given the color white.

The ATM cluster has a price range of $46,518.22 - $49,543.77 with an average price of $48,190.39, total volume of 1.22m BTC, and 2.85m addresses. The current price of the asset Is $48,708.20 falling within the cluster price range.
Out Of The Money
OTM is a cluster category whereby the asset's current price is lower than the price range of the cluster. The cluster is said to be out of money because the asset held in that cluster of addresses was bought above the asset's current price. Hence, the cluster or addresses within that price range is in lossand are given the color red. The OTM clusters act as a resistance zone for the asset.

The highlighted cluster has a price range of $57,128.48 - $134,825.68 with an average price of $62,422.76, total volume of 1.96m BTC, and 4.79m addresses. The current price of the asset is $48,708.20, meaning that the selected cluster is out of the money as the current price is lower than the selected cluster price range.

Question 2: Explain about Large Transaction Volume indicator with examples? What is the difference between Total and Adjusted Large Transaction Volume?Examples?

Large Transaction Volume
The large transaction volume is an on-chain metric that keeps track of all large transactions worth $100,000 and above. The large transaction volume is an on-chain metrics that monitor the actions (transactions in and out of an address) of whales and/or the activities of institutional playersand shows its effect on price.
A spike in the Large Transaction Volume on-chain shows significant interest in whales or institutional players and tells an inflow of large transactions into the asset. Also, a contour in the chart signals that whales are not interested in the asset and an outflow of large transactions from the asset.
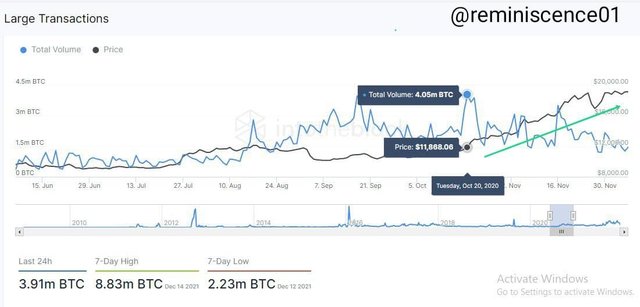
The image above shows a 6 month chart of the large transaction volume on-chain metrics. On the chart, a spike in the large transactions volume of BTC occurred on the 20th of October, 2020 with a total volume of 4.05m and a price of $11,868.06 showing an interest in the asset b the whales. The spike brought about a buying pressure in the asset as price rallied after the spike to $19k by Dec 2020
Difference between Total and Adjusted Large Transaction Volume
Total and Adjusted large transaction volume are types of large transaction volume on-chain metrics. The difference between the total large transaction volume and the adjusted large transaction volume is that the total large transaction volume considers all large transactions, including transactions whereby the asset is moved from one address to another and then back to the initial address. This might give misleading results as one can make multiple transactions involving transfer and re-transfer into the same address.
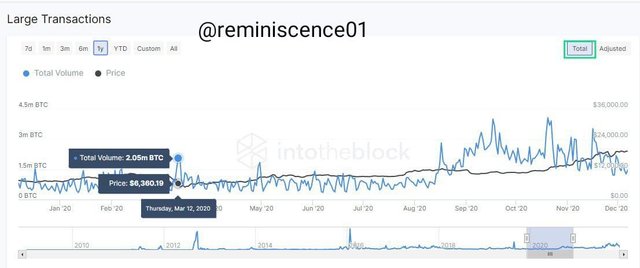
The image above showed a total large transaction volume for BTC over the past 1 year and a spike occurred on the 12th of March, 2020 with a total volume of 2.05m BTC.
The adjusted large transaction volume solves this issue by filtering all transactions that involve transfer and re-transfer into the same address to give true and accurate data of the whale's activities regarding the asset.
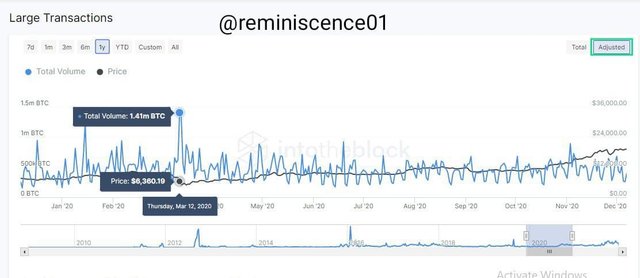
For the adjusted large transaction volume, the total volume was 1,41m BTC on the 12th of March, 2020 after filtering addresses that had transfer and re-transfer transactions.

Question 3: Analyze a crypto asset(other than BTC) using on-chain metric: GIOM, and Adjusted Large Transaction Volume? Ascertain whether it supports a Bullish or Bearish bias or Neutral? How do you find the support and resistance using GIOM? How do you ascertain the upside/downside momentum using GIOM? Use the InTotheBlock app or any suitable app?

Analyzing ETH Using GIOM
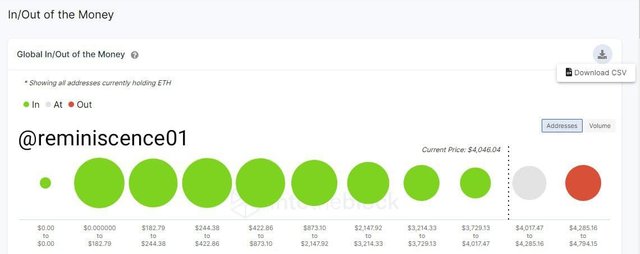
In analyzing ETH using the Global In/Out money on-chain metrics, visit any reliable site. I will be using the intotheblock platform.
Click on the https://app.intotheblock.com/coin/ETH/deep-dive?group=financials&chart=inAndOut and download the data from the site.
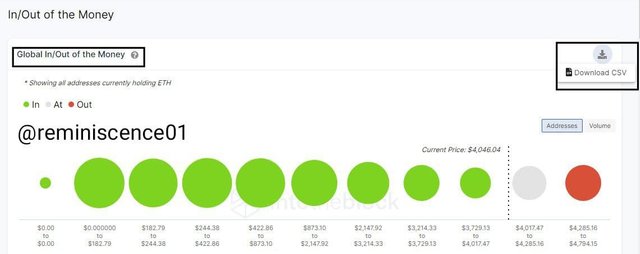
The downloaded data is given below with columns that include; start price, end price, average, addresses, and total volume.
| Start Price | End Price | Average Price | Addresses | Total Volume |
|---|
| Start Price | End Price | Average Price | Addresses | Total Volume |
|---|---|---|---|---|
| 0 | 0 | 0 | 373048 | 1662341.998 |
| 4.50E-08 | 182.7949999 | 141.61364 | 10078440 | 23229907.61 |
| 182.7949999 | 244.3770738 | 214.893174 | 9164424 | 5645553.72 |
| 244.3771723 | 422.8566536 | 326.3102989 | 9770682 | 7854258.148 |
| 422.8569143 | 873.0979543 | 594.2473935 | 9518287 | 8680568.073 |
| 873.1002529 | 2147.918523 | 1502.309848 | 7764704 | 15275363.07 |
| 2147.918784 | 3214.328723 | 2677.230381 | 6204972 | 20372802.64 |
| 3214.332031 | 3729.129177 | 3432.312606 | 4100270 | 6660239.042 |
| 3729.130191 | 4017.470148 | 3883.865391 | 2770809 | 6462450.537 |
| 4017.470933 | 4285.161798 | 4158.940248 | 3614804 | 15429684.12 |
| 4285.162059 | 4794.147727 | 4499.450113 | 4128230 | 6282376.639 |
The total volume as a percentage of the total volume was calculated, and then the current price of ETH was indicated and placed at the price range where it fell.
| Total Vol (% wt of the total) | Current Price |
|---|---|
| 1.41% | ITM |
| 19.76% | ITM |
| 4.80% | ITM |
| 6.68% | ITM |
| 7.38% | ITM |
| 12.99% | ITM |
| 17.33% | ITM |
| 5.67% | ITM |
| 5.50% | ITM |
| 13.13% | $4,046.04 |
| 5.34% | OTM |
The percentage of the total volume in the money is calculated as 81.52%, and the total volume out of the money is calculated as 5.34%. The current price of ETH is $4,046.04 and the percentage of the total volume at the money
- Short Term Range ($3493 - $4475)
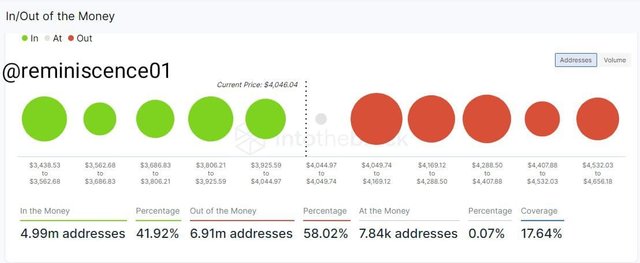
ITM = 41.92%
OTM = 58.02%
ETH is in an indecisive state though trailing towards a bearish market with 58.02% OTM readings. Cautious traders will wait for a wider percentage difference before entering a trade.
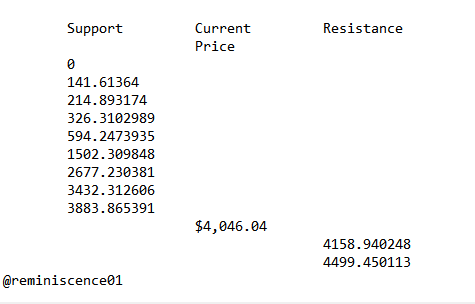
The support and resistance level are given below.
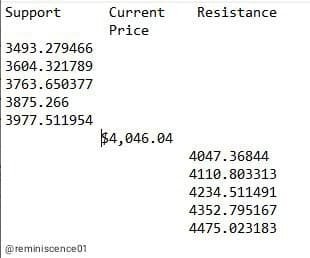
- The Momentum based on GIOM
ETH short term range is supporting current price action to the downside as the number of addresses dropped from 60.97m addresses ITM accounting for 96.9% of the total address as 1.95m addresses were ATM and 0 addresses were 0TM on the 28th of October, 2021 to 55.99m addresses accounting for 83.41%. OTM addresses increased to 9.32m accounting for 13.88% of the total addresses.
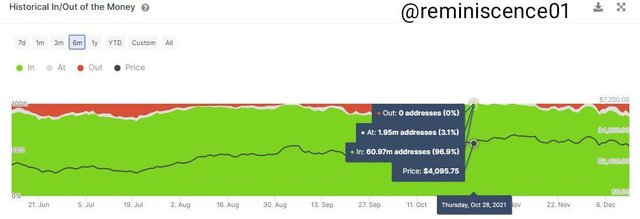
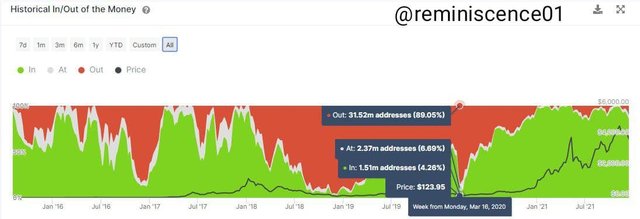
- Long Term Range (Historical Level)
ITM = 88.53%
OTM = 6.12%
ETH is in a bullish state with 88.53% ITM readings. If ETH continues in the bullish run, it might go for price discovery to get a new all-time high as it edges closer to the 100% ITM point.
The support and resistance levels are given below.
- The Momentum based on GIOM
ETH short term range is supporting current price action to the upside as the number of addresses increased from 1.51m addresses ITM accounting for 4.26% of the total address as 2.37m addresses were ATM and 31.52m addresses were 0TM on the 16th of March, 2021 to 62.8m addresses accounting for 98.44% on 1st November, 2021. OTM addresses decreased to 32.24k accounting for 0.05% of the total addresses.

Conclusion

GIOM is an on-chain metrics that uses clusters to classify addresses based on the price range of when the asset was bout to have a global view of addresses in profit or out of money. Large Transaction Volume is an on-chain metric used to monitor the activities of transactions $100,000 and above. The metrics tracts the activities of whales to check the inflow and outflow of large transactions and their effect on price.
Thank you, prof @sapwood, for a fantastic lesson.