Crypto Trading with SuperTrend Indicator - Crpypto Academy S5/W7 - Homework Post for @kouba01.


Hello Steemians, It's great to be here again in the 7th week of Season 5 in the Steemit Crypto Academy. In this week's lesson, professor @kouba01 has introduced us to another crypto trading technique using the SuperTrend Indicator. Indicators are an essential part of technical analysis traders can rely on to make good trading decisions. In this post, I will answer the questions given at the end of the lesson.
Understanding SuperTrend Indicator and it's Calculation
As a retail trader, it is advisable to trade according to the direction of the trend. "The trend is your friend" is a common saying in the financial especially to the retail traders. Trading according to the trend gives you insight into the current situation of the market. There are so many technical analysis tools available to determine the market trend. The SuperTrend indicator is one of the trend-based indicators that help to identify current market trends.
SuperTrend indicator is a trend following indicator. With the SuperTrend Indicator, traders can be able to identify the market trend and also determine buy and sell signals. Indicators are gotten from mathematical models of price data points. The SuperTrend is not different as it is calculated using the average values of the candlestick. Also, the indicator calculates the volatility of price by incorporating the Average True range (ATR) into its calculation.
The Supertrend indicator gives buy and sell signals to traders with varying trend directions which are shown using green and red colors of the indicator. When price is below the Supertrend indicator, it indicates a downtrend as the indicator changes to a red color. Similarly, when price is above the indicator, it indicates a bullish trend with a green indicator color. Also, in the absence of a trending market, the indicator is seen to be flat which shows that price is ranging. The supertrend indicator serves as support when price is in an uptrend and it serves as a resistance when price is in a downtrend.
The period (ATR length) and the multiplier (factor)is sensitive parameter of the indicator which when altered or changed affects the performance and signal from the indicator. The period (ATR length) determines the length of the period put into consideration. The longer the period, the more accurate the signal from the indicator. Also, the factor serves as the multiplier.
The default values for the ATR length is 10 while the default value for the factor is 3. These values are not the most efficient, it can be modified to suit a trader's style. The ATR is an important parameter of the Supertrend indicator as the indicator utilizes the ATR to measure the indicator value as well as price volatility.
SuperTrend Indicator Calculation
Indicators are gotten from mathematical models of price data points. For the SuperTrend indicator, the period and the factor are the base parameters of the SuperTrend indicator. This is utilized to calculate the SuperTrend Downtrend and Uptrend.
- Uptrend = (High + Low)/ 2 + factor (multiplier) × Period (ATR )
- Downtrend = (High + Low) / 2 - factor(multiplier) × Period (ATR)
Understand that;
- Adding a multiple of the volatility determines the Uptrend. Here, the indicator's volatility is calculated by deploying the ATR (Average True Range).
- Subtracting a multiple of the volatility determines the Downtrend. Here, the indicator's volatility is calculated by deploying the ATR (Average True Range).
The Supertrend indicator signal is based on price volatility which is calculated based on the ATR indicator. The following parameters are needed to compute the ATR. First, we calculate the True range which is gotten by selecting the highest between the following equations:
- 1st TR = Current High - Current Low
- 2nd TR = Current High - Previous Close
- 3rd TR = Current Low - Previous Close.
Then ATR is calculated by taking the simple moving average of the True range using 10 periods (default period). This is stated as follows using the mathematical equation below.
ATR = max [True range] / 14.
The formula above is used to calculate the first ATR using the defined period. The current ATR is calculated using the formula below:
Current ATR = [(Previous ATR * (n-1) + Current TR] / n, where n is the number of candles considered (periods).
This calculation is carried out for the current candle and this helps the SuperTrend indicator to determine and follow the market trend.
Main Parameters of the SuperTrend Indicator and how to configure it
The SuperTrend indicator is versatile and can be used for both long-term, short-term and medium-term trades. It all depends on a trader's trading style and the efficiency of the indicator strongly depends on the configuration of its settings.
The main parameters of the SuperTrend indicator are the Period(ATR length) and the factor (multiplier). The ATR is a very important parameter of the indicator which forms the basis of the indicator volatility calculation. The SuperTrend determines takes into consideration the volatility of price in its value by deploying the ATR in its calculation. On the other hand, the multiplier with default settings of 3 determines the sensitivity of the indicator to the current price when multiplied by the ATR. This can lead a trader to fall for false breakouts and fakeouts.
Selecting shorter indicator periods makes of very reactive to price as there no much price data to be taken into consideration. However, as I said initially, it depends on a trader's trading style and the information to be obtained with the use of the indicator.
The indicator comes with a default period of 10 and a multiplier of 3. This is not considered the best setting for the SuperTrend indicator. As a trader, you must review your trading style and also backtest the efficiency of the indicator using different multipliers.
Let's look at the sensitivity of the indicator to price with varying factors. In this contest, we will consider factors 2,3, and 5 while keeping the Period at a constant value of 10.
From the chart above, we can see a lot of trading signals from the Supertrend indicator when using Factor 2. This shows how sensitive the indicator reacts to price. We can also see a lot of false buys and sell signals that don't correspond with price action.
From the chart above, we have changed the factor of the previous chart to Factor 3, we can see that some of the false signals have been filtered. Using higher factors helps to filter noises and false signals from the indicator. The higher the factor, the less sensitive and more clean the indicator signals give. The chart below shows the combination of factor 2 and factor 3 on the same chart. We can see how using factor 3 has helped to have a more accurate signal from the indicator.
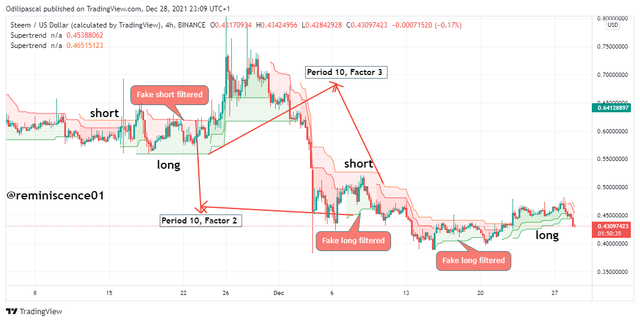
Looking at the chart above, we have a Supertrend indicator with a factor 5 on the same chart. We can see less reaction and the trading signal from the indicator. Price sensitivity here is low when compared to factors 3 and 2. None of these settings are best. Like I said previously, it depends on a trader's trading style and also the type of asset being traded.
Identifying Trend Using SuperTrend Indicator
SuperTrend indicator is a strong trend following indicator traders can utilize to ride massive trends without getting faked out with little price volatility. Other indicators are sensitive to little price variation given mixed signals on a current trend. Meanwhile, the SuperTrend indicator doesn't change with little price volatility due to its coefficient value that can be adjusted.
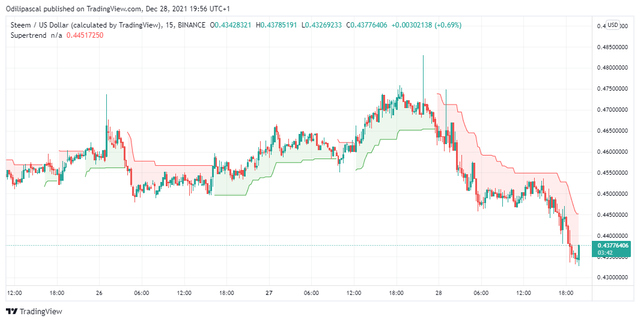
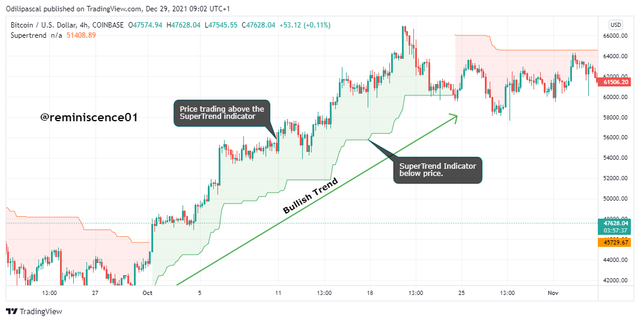
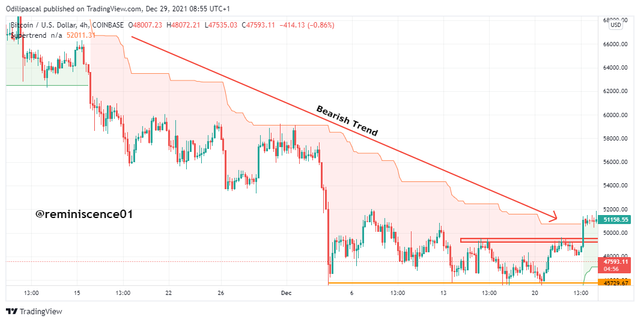
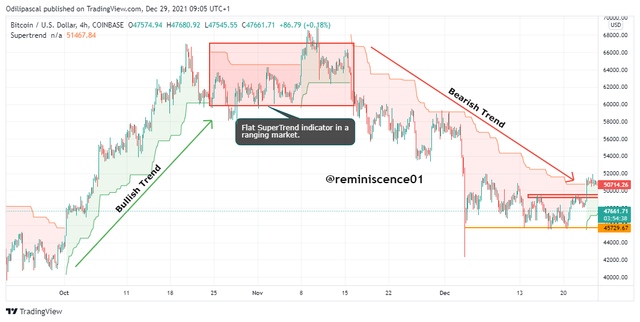
The indicator signals red and green colors depending on the current market trend. During a strong bullish trend, we tend to see a green SuperTrend indicator below price. Similarly, during a strong downtrend, we tend to see the SuperTrend indicator above price. The flipping of the indicator color and also the position of the indicator above and below price is a trend identification signal using the SuperTrend indicator. In the absence of no trend (Ranging market), we tend to see the indicator flat indicating low momentum in the market. Examples can be seen in the charts below.
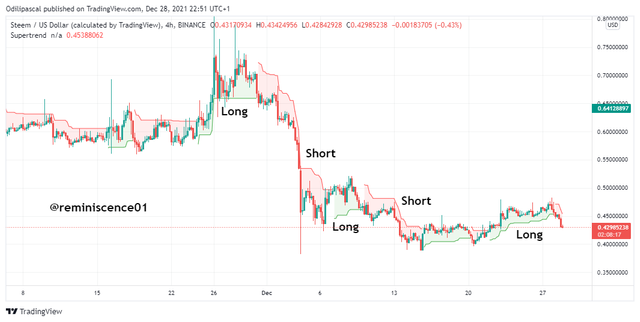
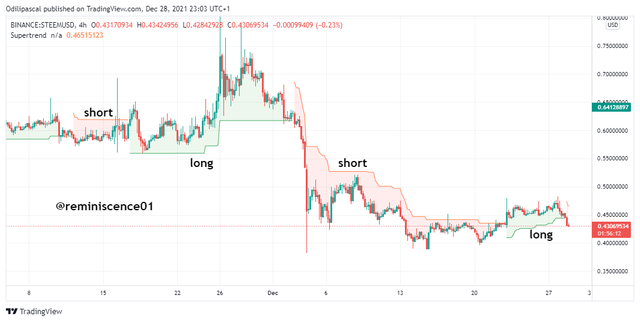
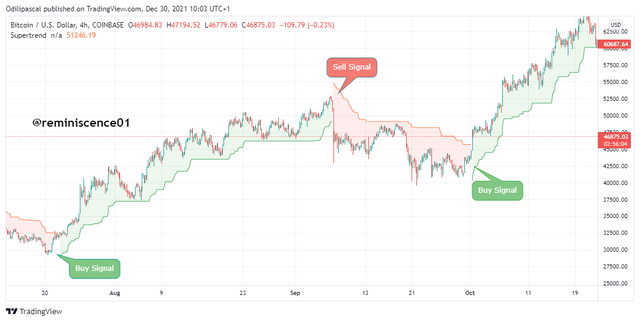
Understanding Buy and Sell Signals Using the SuperTrend Indicator
There are amazing things a trader can do with the Supertrend indicator. Aside from identifying market trends, traders can utilize the Supertrend indicator to identify buy and sell signals. This will give them an accurate time to enter the market.
The position and the color of the Supertrend are used to determine market signals and also spot buy and sell signals. Also, traders can determine exit positions using the Suptrend indicator. The change in the position and color of the indicator can be used for this purpose. During a bull is position, if the indicator changes to red color and price breaks below the Supertrend indicator, this can serve as an exit signal to close the buy positions.
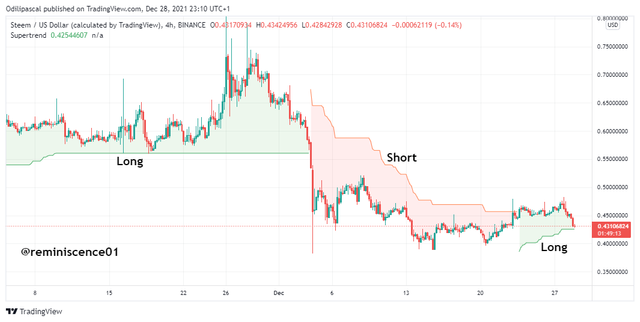
A buy signal position can be identified when the price crosses above the Supertrend indicator with a green color. This signals a bullish momentum and a buying opportunity for traders. Similarly, when price crosses below the Supertrend indicator with a red color, it signals a bearish trend and a selling opportunity for traders.
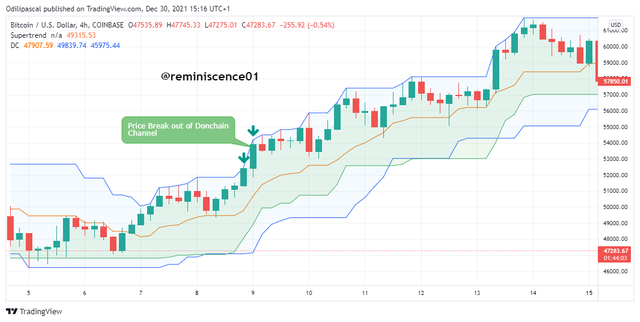
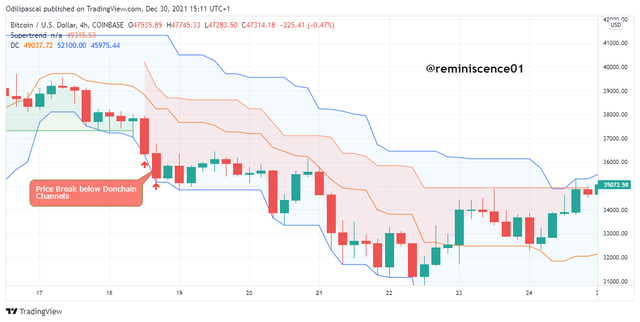
Determining Breakout Points Using SuperTrend Indicator and Donchain Channel Indicator
Apart from identifying trends and also buy and sell signals, the SuperTrend indicator can also be used by breakout traders to take advantage of price breakouts in the market. To utilize the Supertrend indicator for breakouts, it is combined with another trading tool which in this case is the **Donchain Channels. The Donchain channels formed a lower band and an upper band which indicates the highs and lows of price over N periods. By default, a 4 weeks period is used to generate the highs and lows over the last 4weeks period.
When the Donchain channels are combined with the Supertrend indicator, price breakouts can be identified. The Supertrend indicator in this case serves as a trend signal while the breakout is seen from the Donchain channels.
For a bullish breakout to be confirmed, price will be trading above the Supertrend indicator with a green color to identify a bullish trend, then a bullish position can be executed when at least 2 candlesticks break out of the Donchain channel upper band. This can be seen on the chart below.
Similarly, for a bearish breakout using Supertrend and Donchain Channel, price breaks the lower band of the Donchain with at least two candlesticks. The Supertrend indicator in this case is seen above price with a red color indicating a bearish trend. An example can be seen in the chart below.
The Effectiveness of Combining Two SuperTrend Indicators In Crypto Trading
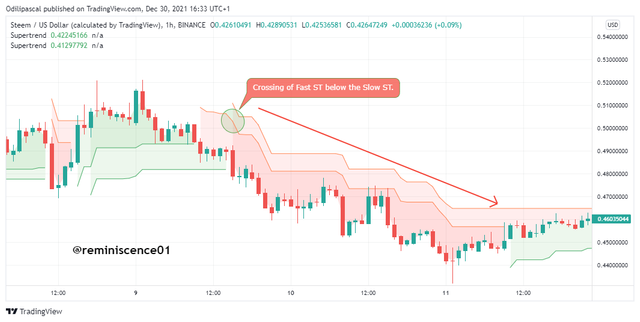
There are many ways to optimize the use of a technical indicator. This can be through the combination of the indicator with other trading tools to help and filter false signals and also to strengthen the indicator signal. In the case of the Supertrend indicator, we can utilize two Supertrend indicator lines to generate trading signals. Just like two moving averages (Fast & Slow) are combined.
For the Supertrend indicator, a fast Supertrend (21 period, factor 2) and a slow one ( 10 period, factor 3). The crossing of the fast and slow ST serves as a strong buy and sell signal. When the fast indicator crosses above the slow indicator with both turning green, we have a bullish signal.
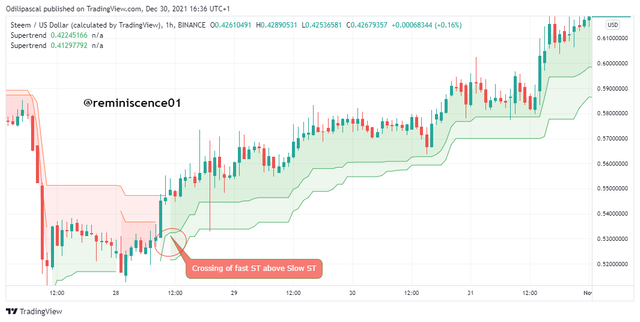
Similarly, the crossing of the fast ST below the small ST with both indicators turning red is a strong sell signal. This can be seen on the chart below.
Combining SuperTrend Indicator with another Technical Indicator
Technical indicators are not advised to be used as standalone trading strategies. The reason is that indicators are not always accurate and they sometimes give false signals when used alone. Combining indicators with other trading tools or other indicators help to filter out false signals and also strengthen indicators' signal. For this reason, I will be combining the ST indicator with Two Exponential Moving Average (EMA).
The EMA is a trend-following indicator that can also be used to identify buy and sell signals in the market. I will be combining a slow EMA (50 period) and a fast EMA( 21 period). This will be used to filter out false signals from the ST indicator.
The crossing of the fast EMA above the slow EMA indicates a buy signal, while the crossing of the fast EMA below the slow EMA is a sell signal.
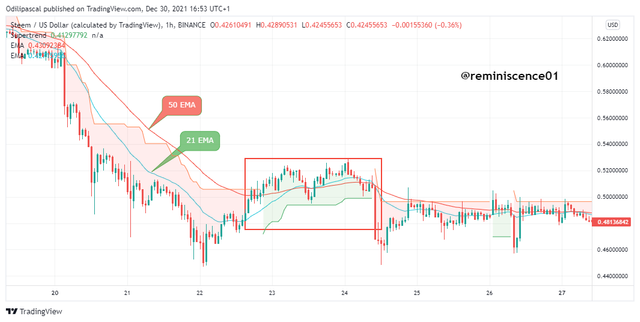
Looking at the chart above, we can see a false signal from the ST indicator that would have led to a loss. Here, the ST indicator signaled a buy signal as the price is trading above it, and also price turned green. But looking at the **EMA, we can see that the fast EMA hasn't fully crossed above the slow EMA. We can see that the EMA has helped to filter out the false signal from the ST indicator.
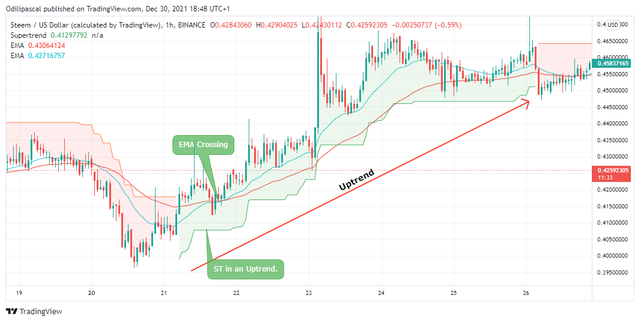
Looking at the chart above, we can see how we can utilize the EMA to make the signal from the ST indicator better. From the chart, we can see how the EMA helped to confirm the buy signal from the ST indicator. Price changed from a bearish to bullish trend as price breaks and trades above the ST indicator with a green color. After that, the buy signal from the ST can be confirmed as the fast EMA crossed above the slow EMA which shows a bullish signal.
Advantage and Disadvantages of the Supertrend Indicator
Advantages of Supertrend Indicator
- The ST indicator is great as the indicator can be used to take advantage of large trend movements in the market.
- The indicator signal is very simple to read on the chart. The change in the color of the indicator and the position of the indicator serve as buy and sell signals.
- The ST indicator signal works better and gives accurate signal information when is combined with other technical analysis tools.
Disadvantages of Supertrend Indicator
- The indicator is not suitable during a ranging market. The indicators only work best in a strong trending market.
- The indicator cannot work as a standalone trading strategy. It works best when combined with other technical analysis tools to filter its signal. This makes the indicator less reliable.
Conclusion
Technical indicators are good technical analysis tools traders can adopt to make good trading decisions. The Supertrend indicator is one of the trends following indicators that can be used to identify market direction as well as buy and sell trading signals. The indicators also identify breakouts when combined with the Donchains Channels.
Technical indicators are prone to false signals when used as a standalone trading strategy. The Supertrend indicator is not different as the indicator gives better trading signals when used with other trading tools.
Thank you @kouba01 for this amazing lesson on Supertrend Indicator.