Crypto Trading with Moving Average - Crypto Academy |S6W2| - Homework Post for Professor @shemul21


Hello Steemians, Welcome to the 2nd week of Season 6 in the Steemit Crypto Academy. Today's lesson was delivered by professor @shemul21 on Crypto Trading with Moving averages. Moving averages are one of the technical indicators used by almost every trader in the market today. The importance of moving averages in technical analysis today is not overlooked as traders rely on moving averages to make the good trading decision in the market.
Understanding Moving Averages
Technical indicators are one of the technical analysis tools in the market which serves as a trading signal to traders or as a signal confirmation tool to other technical analysis tools. The moving average is a trend-based technical which plays a key role in understanding the direction of price. Traders rely on the moving average to identify the current price trend and also spot potential trend reversal as price breaks above and below the moving average.
The moving average is calculated using a mathematical equation of price data points to plot the average price over a while. This moving average plotted helps to filter current price fluctuations which traders to spot trading signals in the market. A 200 moving average will take account of average data price points over the past 200 days. Let's look at an example of the moving average on the chart.
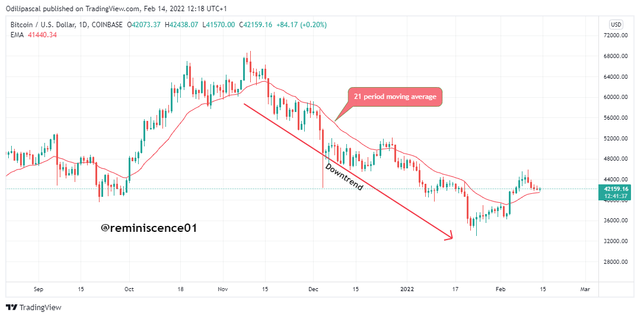
Looking at the chart above, we have added the 21 moving on the chart. From the chart, we can see that the moving average helped to identify the current price trend. Looking at the chart, the price is currently trading below the moving average price which shows that price is in a downtrend. Aside from identifying trends and signal information, the moving average also serves as dynamic support and resistance which can spot future price reversal points.
Let's look at the different types of moving averages
Different types of Moving Average
Technical indicators take into account some price data points in their calculation for signal information. The same scenario applies to the moving average. There are so many moving average indicators in technical analysis today. The major difference between these moving averages is the parameters and data points taken into consideration during the calculation. We will be looking at the 3 most common and effective moving averages in the market.
Simple Moving Average (SMA)
The simple moving average is considered the simplest type of moving average. The simple moving takes into account the average price of a cryptocurrency over some time The simple moving displays the true average price over a period taking into account. The simple moving average is plotted dynamically as the price fluctuates. Let's look at the formula for calculating the simple moving average.
SMA = (A1 + A2 +...+An) / n
Where A represents Average price data points over a specified period.
n = Number of periods taken into account ( e.g 200 day periods)
Exponential Moving Average(EMA)
The EMA was developed because of the lags encountered in the simple moving average. Though the SMA and the EMA are similar, the EMA is a more advanced moving average that gives more weight to recent prices. The EMA aims to develop a moving average that reacts faster to recent price movements. Short term traders find the EMA useful as it helps them to get recent price information in the market. Other than SMA that lags behind price making it difficult for traders to get price signals on time. Both the SMA and EMA are important for good trading decisions as traders can combine these two indicators to obtain both long term and short term price information. Below is the formula for EMA calculation:
EMAc = [ Cp × (s/1+n)] + EMAp × [1 - (s/1 + n)]
Where ;
EMAc = Current EMA
Cp = Current price
EMAp = previous day EMA
s =Smoothing factor
n = Period (number of days)
Weighted Moving Average (WMA)
The idea behind Weighted moving average is that information about the current price is more important than the previous day price. The SMA and the EMA take more consideration of the previous data points. Meanwhile, the WMA gives more weight to the recent data points which the indicator react faster to the current price. Short term traders find the WMA useful as it reacts faster to little price changes in the market. The WMA is calculated as follows:
WMA = (Price1 × n + Price2 × (n-1) +...Pricen)/ [ n × (n+1)/2]
n = Period(number of days)
Difference Between EMA, SMA and WMA
In this section, we will look at the difference between the SMA, EMA and WMA to enable traders to understand the uses of each of them and then select the best that suits their trading style.
| SMA | EMA | WMA |
|---|---|---|
| SMA takes into account the average price of a cryptocurrency over some time | The EMA takes into account the current price and a multiplier for smoothing | The WMA takes into account the most recent price data point while paying less attention to the previous data point |
| The SMA is suitable for long term trading style as it enables takes into account average price to spot long term trends | The EMA is good for short term trading styles as it reacts faster little price movement and also for spotting reversals | The WMA is more sensitive to price as it focuses on recent data for price signals. This is ideal for scalp trading strategy |
| An SMA with a high value is more reliable to obtain accurate signals. This is because longer price data points are calculated to obtain a filtered signal. | EMA with a lower value is seen to be more reliable as the indicator add weight to the recent price for signal. | The WMA is reliable in both higher and lower values. This is because more emphasis is focused on the most recent price. Even in higher values, more weight is added to the recent price. |
| SMA lag behind price | EMA reacts faster to price change. | The WMA is more sensitive to little price |
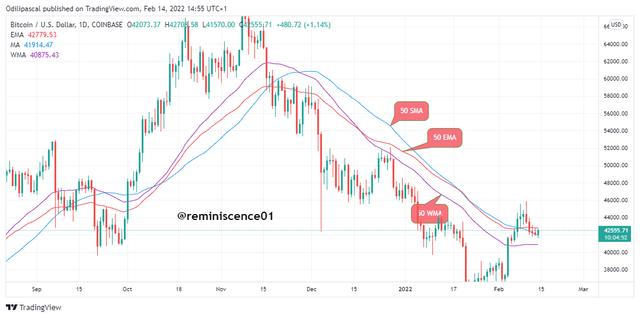
Looking at the chart below, we can see the difference between the 3 moving averages. The WMA is seen closer to price as it reacts faster to small price movement. Also, the SMA is away from price. The SMA lags behind price but it is useful for long term traders. On the other hand, the EMA is also seen to be closer to price as a result of the smoothing added to the recent price in its calculation this makes it also react faster to price changes.
Identifying Entry and Exit Points Using Moving Average
The moving average plays a crucial role in determining exit and entry points in the market. To further illustrate how we can identify entry and exit positions using moving averages, I will be combining two moving averages for this purpose. The SMA (50 periods) which represents the average price data points will be used to determine the direction of price. During a strong uptrend, the price is seen to be trading above the SMA. At this, we can now go down to the EMA (20 periods) to look for a buy position. The EMA here is used because it reacts faster to price and it also displays the interaction of traders in the market.
In the previous section of this post, we have explained how the moving average serves as dynamic support and resistance. During a strong uptrend, price retraces down to the moving average to find support. After that, a buy position can be executed as the price reverses up after getting rejected on the moving average. Let's look at the chart below.
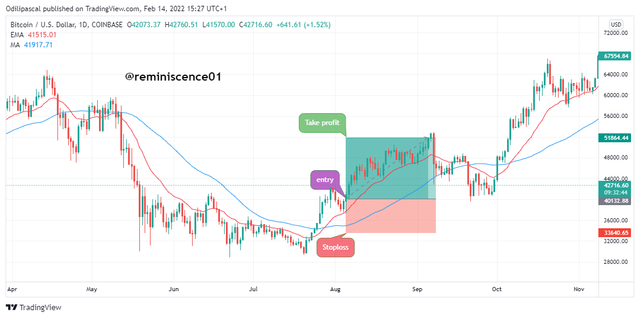
From the chart above, we can notice after the trend reversal from bearish to bullish, the price retraced back to find support on the 20 EMA. After that, a bullish entry position can be executed with a bullish engulfing candle. Stoploss for this position can be placed below the 100SMA. The reason is that if the price should break below the 100SMA, it indicates a bearish reversal which the buy position.
Let's look at the chart below for a sell trade opportunity.
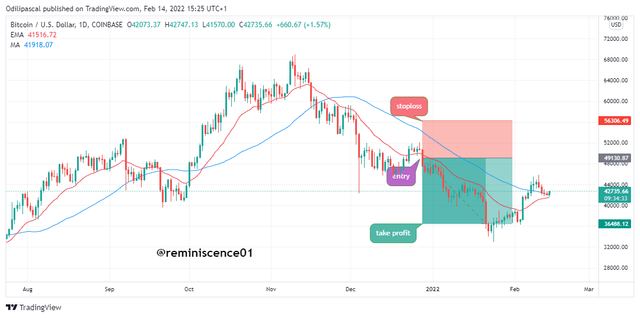
Looking at the chart above, we can see that the two moving averages are above the price which shows that the market is in a downtrend. In this situation, we look for a sell entry when the price finds resistance on the 20EMA. This can be seen on the chart above as the price is retraced back to the 20EMA. An entry position can be seen after a bearish engulfing candle with a stop loss placed above the 100SMA.
Moving averages are powerful technical analysis tools that do not only help in identifying trends. The indicator also helps to spot entry and exit positions in the market. In this section, I have used the 20 EMA and also 100 SMA. This is my preferred setting for the period as it suits my trading strategy.
Understanding Moving Average Crossover
Moving average crossing is a technique to take advantage of trend reversals using a combination of two moving averages. This will probably be a slow and a fast-moving average. The fast-moving average reacts to price faster as it only takes a few data points in its calculation. However, the slow-moving average reacts slower to price as it required price data points for a large number of days in its calculation.
When the faster moving average crosses above the slow moving average, it signals a trend reversal and an opportunity to look for a buy position.
Similarly, when the faster-moving average crosses below the slower moving average, this signals a bearish reversal and an opportunity to take a sell position. In the chart below, I have combined a fast-moving average (20 EMA) and a slow simple moving average (SMA) on BTC/USD chart.
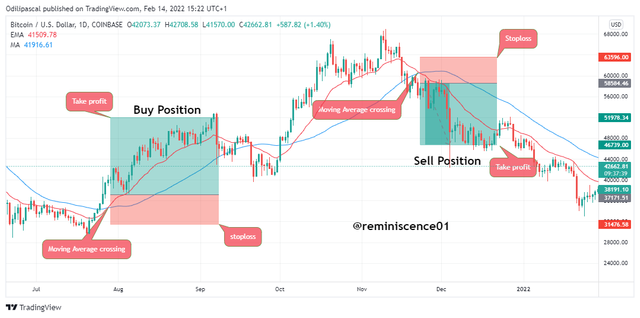
From the chart above, we can notice the crossing of the faster-moving average above the slower moving average. The crossing signalled a trend reversal bearish to bullish as we see price trend up. A good entry opportunity can be after the breakout candle with a stop loss placed below the slow moving average.
On the same chart, after the cross that initiated the bullish trend, the price broke the faster moving average which signals exhaustion and reversal of the bullish trend. The bearish reversal is confirmed with the crossover of the fast-moving average below the slow-moving. A sell position can be after the breakout candle below the fast moving average with a stop loss placed above the slow moving average.
While the crossover is a good technique to get an entry during reversal, understand that the strategy works only in a trending market. Moving average crossing in a sideways market can false price information which can lead to losses. Also, the configuration of the fast and slow-moving average depends on a traders strategy. Scalp trading style will utilise lower periods like the 9 EMA for fast moving average and 21EMA for slow-moving. It all depends on your trading style.
Limitations of Moving Average
In this study, we have explained key information on moving average and how we can spot useful trading signals using the moving average. Technical indicators are not reliable and as such can signal false signals in the market. It is not advisable to use a technical indicator as a standalone trading system. Let's look at the limitations of the moving average indicator.
Moving average rely on historical price data points for its calculation. The indicator does not take into account other price information and fundamental factors that might affect the price.
The moving average is a lagging indicator as it takes into account historical price data points. This means that the indicator can mislead traders into opening a position when the price movement has already occurred.
The moving average is sensitive to the period used. When a trader selects a period in the wrong timeframe, this can lead to a false trading signal in the market. For example, what might be a bullish trend in 9EMA might be false in 20EMA.
The moving average works best in a trending market. During a sideways market, the moving average does not work properly or identify any useful price information.
Conclusion
Technical indicators are powerful technical analysis tools in the financial market today. We have discussed the moving average and also how we can obtain useful price information using the moving average. We have also highlighted the limitations of the moving average to help you understand the risks involved in relying on the moving average for trade signals.
Technical indicators lag or lead behind the current price. This means that they do not reveal the current price movement as they felt on historical data points in its calculation. It is advisable to combine moving average with other technical analysis tools to filter out any false signals from the indicator. Finally, the crypto market is highly volatile and can lead to the loss of entire capital. Always maintains proper risk management in any trading decision in the market.
Thank you @shemul21 for this amazing lesson on moving average.