Crypto Academy Week 16- Homework Task for Professor @Kouba01| Bollinger Bands|
.jpeg)

Bollinger Bands
Bollinger bands was developed by famous financial analyst John Bollinger in the early 1980s. Bollinger band is a technical indicator used to measure the volatility of price. Similarly, the indicator also works as an oscillator and can be used to determine when the price of an asset is in an oversold or overbought condition.
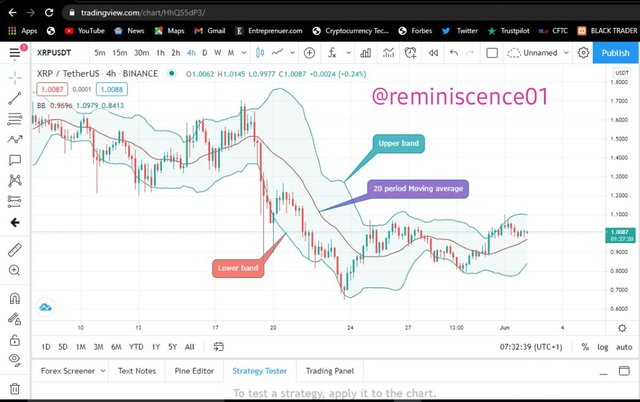
Bollinger bands are a kind of dynamic channel that consist of the upper band and the lower band. The upper band and the lower of the Bollinger bands are plotted at a standard deviation of the simple moving average usually 20 period by default. The upper band is plotted at a standard deviation above the simple moving average, while the lower band is plotted at a standard deviation below the simple moving average.
Note that 2 standard deviations are used for calculating the upper band and the lower band because we are using a 20-period moving average. Although these parameters can be adjusted to suit a traders trading style. When the upper and the lower band are plotted, trading decisions can be made based on price movements within the Bollinger band. The representation of the Bollinger band can be shown in the chart below.
Calculation of Bollinger Bands
We have established the two parameters needed to calculate Bollinger bands which is the moving average and the standard deviation. The moving average calculates the average closing price of an asset for a selected period while the standard deviation measures how far price is from an average value. Here the average value is the moving average.
The upper band of the Bollinger band is calculated by adding 2 standard deviations to the moving average while the lower band is calculated by subtracting 2 standard deviations from the moving average. This can be represented mathematically below:
Moving Average (MA): Sum of prices over * days/number of days
Upper band: 2 standard deviation + MA
Lower band: 2 standard deviation - MA
The amazing thing is that you do not have to do this calculation yourself as Bollinger bands are custom built-in on almost every platform.
How Bollinger Band Works
Bollinger bands can be used to determine the volatility of price of an asset. Also, it can be used to determine the overbought and oversold condition of price. We will discuss each of these in this section.
Volatility
Bollinger bands can be used to measure the volatility of price of an asset. This can be determined during the tightening and expansion of the Bollinger bands. When the Bollinger band tightens or squeeze, it shows that the volatility of price is very low. This is usually seen in a ranging market. A squeeze in the Bollinger is signalling a beginning of a new trend that can break out in any direction. An example can be seen in the chart of XRP/USD below. Price has been in a range between $0.63 and $0.44 since the beginning of March 2021. And this range can be seen as the Bollinger band gets tightened during this period. On April 2021, price broke out to the upside and we saw an expansion of the Bollinger band which indicates a high volatility in the price of XRP
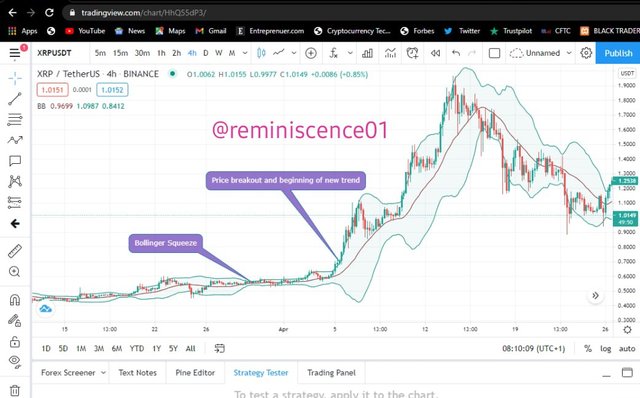
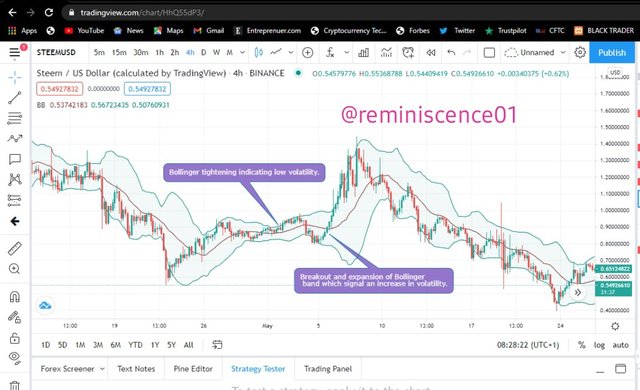
Breakout traders can use the Bollinger band to know when there is low volatility in the market and plan for a breakout. The breakout can be in any direction depending on the fundamental information that led to the breakout. It can be negative or positive and traders need to be careful during Bollinger band squeeze as price can break out in any direction. A similar example can be seen in STEEM/USD in the chart below.
Determining Oversold and Overbought conditions of price
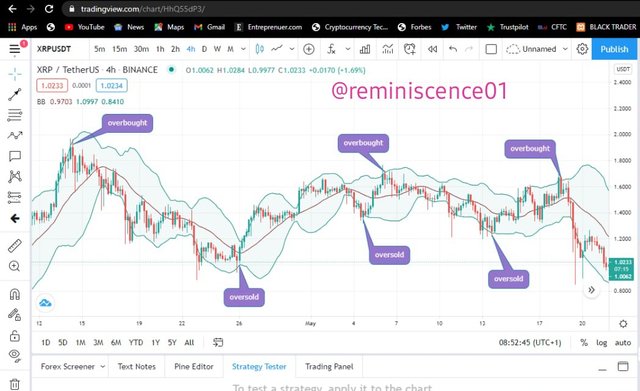
The overbought and oversold condition of price can be determined using Bollinger bands as price bounces within the Bollinger bands. Traders can use this as entry and exit points in the market. When price touches the upper Bollinger band, it can give a powerful signal especially when it in confluence with price action resistance area. A trader can look for potential buying opportunity using a candlestick reversal pattern like the bearish engulfing pattern or an inverted hammer.
Similarly, when price hit the lower band and corresponds to a price action support area, this signal price reversal and also profit-taking signal. Buying can also look for an opportunity to go long using a candlestick reversal pattern. An example can be seen in the chart below.
Bollinger Band Setup
In most trading platforms, the Bollinger band comes with a default setting of 20 period moving average and a Standard deviation of 2. It is assumed by statistics that the price remains within the upper band and the lower band. Though these might be the default settings, it can't be termed as the best Bollinger band configuration settings as we all have different trading strategies. A swing trader might consider using a 50-period moving average and 2.5 standard deviation configuration. So it depends on the trading style which a trader has tested and found convenient to suit his trading strategy. But by default, 20 period and 2 standard deviation work fine. Let's take look at the Bollinger Band configuration on Tradingview platform.
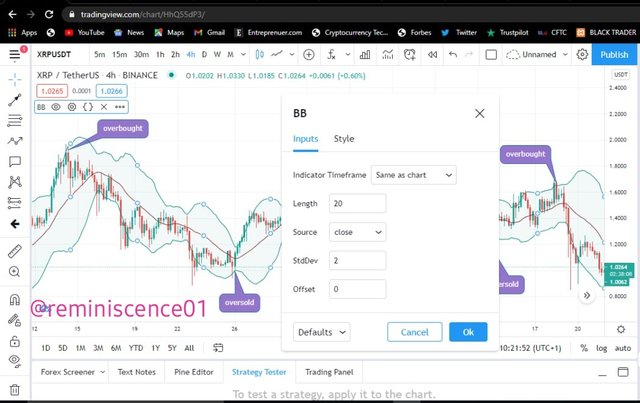
The picture above shows the default configuration of Bollinger band on Tradingview platform. The Indicator timeframe is set as same as chart for traders who carry out multi-timeframe analysis.
- The length is set as 20 by default and this represents the last candle bars for the last 20 days.
- The source is set as close. This means that the moving average will be calculated using the closing price of the day.
- Standard deviation(StdDev) is set at 2. And this means the standard deviation will be multiplied by 2 for the spacing of the upper and lower bands.
- The offset is set 0, which means the number of candles ahead of the graph.
Bollinger Band Breakout and How to Determine it
A breakout occurs due to an increase in the volatility price of an asset. This can be seen as price move out of a predetermined range or area. For example, price moving outside a support and resistance level, price moving below a trend line, price moving outside a channel, or price moving above and below a moving average. In the case of a Bollinger band, a breakout is seen when the Bollinger band move outside the bands and expands after a squeeze. The breakout indicates that the volatility has increased in the price of an asset. Using price action support and resistance can also help to spot breakouts. Let's look at an example on XRP/USDT chart below.
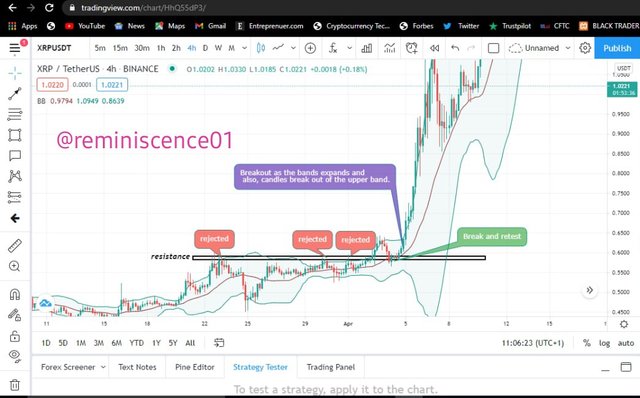
From the chart, we can see a breakout of Bollinger bands on XRP/USDT. The Bollinger band was squeezed between 22nd March 4th April 2021. Similarly, drawing a resistance level on the chart, we can see that price has rejected the resistance level during these periods. Price was rejected at this resistance at $0.59 for three consecutive times. On 4th April, price broke out of the resistance level and we can also see the candles break out of the upper band. This is a sign that a breakout is about to happen.
After that, price came down to retest the resistance level at $0.59. Similarly, the resistance level in confluence with the 20 moving average which serves as a dynamic support. Price failed to break below the 20 moving average which indicates a breakout to the upside. And after that, we can see a strong breakout as the candles kept closing outside the upper band. Similarly, we can also see an expansion of the Bollinger band as this breakout occurred which shows that volatility has increased in the market.
How to use Bollinger bands with a trending market
In a trending market, price is forming higher-highs and higher-lows for an uptrend, and also lower-highs and lower-lows for a downtrend. During this time, there's high volatility in the market and we can see the Bollinger bands wider. In an uptrend, a trader can be looking for a buying position as price come down to the 20 period moving average of the Bollinger as this serve as a dynamic support. Similarly, a trader can also look to go long when price touches the lower band during an uptrend. The upper Bollinger band can serve as a profit-taking level for an uptrend, while the lower band and the 20 moving average can serve as an entry-level.
Note that, entry positions using the Bollinger band in a trending market should be confirmed using candlestick reversal patterns like bullish engulfing pattern and the hammer. An example of Bollinger band in an uptrend can be seen in the XRP/USD chart below.
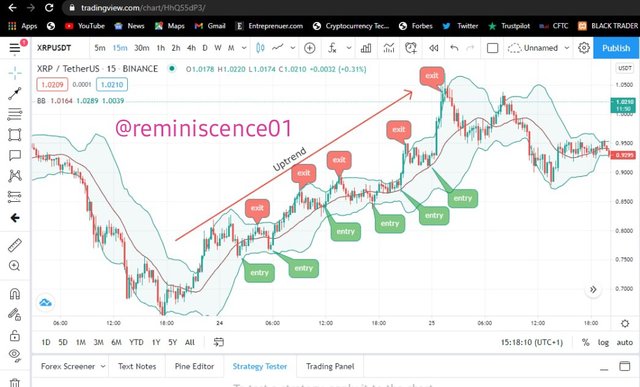
From the chart above, we can see how we can use Bollinger band to capture the entire move in an uptrend. Notice how price always comes down to retest the lower band and the 20 period moving have for a continuation to the upside. Candlestick analysis will be beneficial to make good entry opportunities.
Bearish Trend
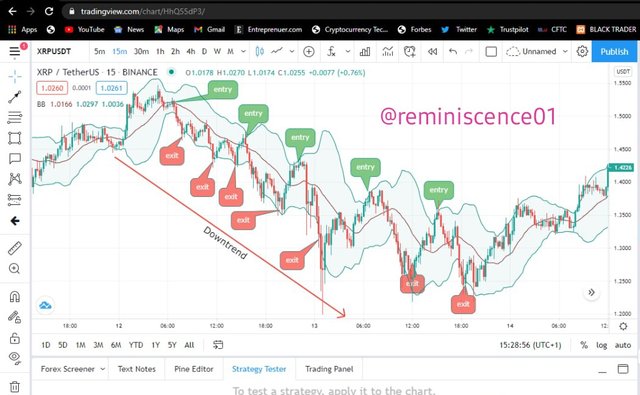
The chart above shows how we can use Bollinger band in a downtrend. From the chart above, price makes lower lows and lower high points. The 20 period moving average and the upper band serve as dynamic resistance and price tends to reverse back and continue the downtrend when it hit these areas. Traders can buy short opportunities when price come to this area in a downtrend using candlestick reversal pattern like the bearish engulfing candle and the hammer to confirm an entry. Exit should be at the lower band as price pullback to the 20 moving average and the upper band to continue the trend.
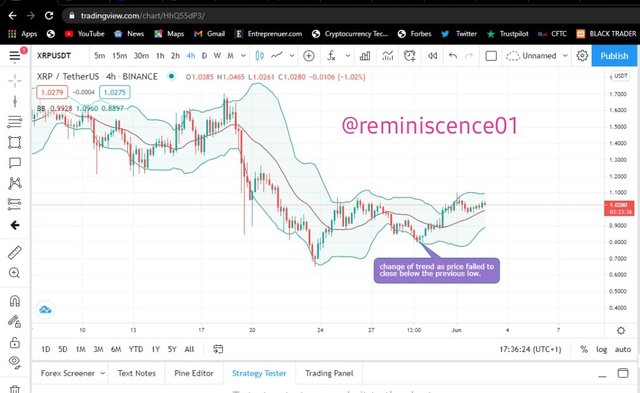
Identification of new Trend
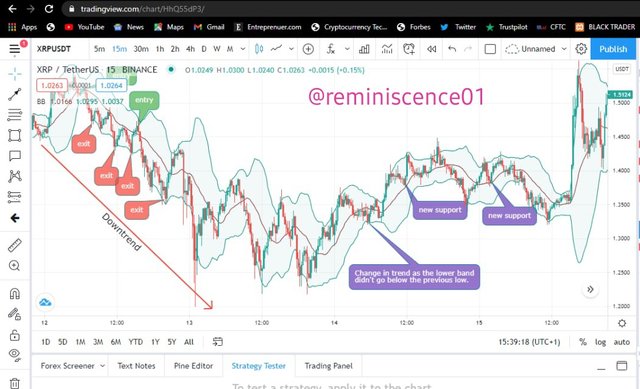
From the chart above, we can see how the bearish trend changed to a bullish trend. This can be seen as the lower Bollinger band failed to go lower than the previous low. We know that in a downtrend, price makes lower low formation. Since there's no lower low formed, it signals a trend reversal from bearish to bullish.
Similarly, we can see how price found support on the 20 period moving average which indicates that the trend has changed from bearish to bullish trend as price makes higher high and higher low formations.
The Bollinger band when combined with candlestick patterns will make a good trading experience for riding trending markets.
The Best Indicator to use with Bollinger Bands to make trade more meaningful
An Indicator will work best when combined with another indicator of the same class or different class that aim to give similar price information. A good example is the RSI indicator which determines the oversold and overbought condition of price by measuring recent price changes. The RSI also uses the average closing and opening price in its calculation to measure the momentum of price. By default, a reading above 70 is considered as an overbought condition and a reading below 30 is considered as an oversold condition.
Though RSI and Bollinger band makes use of different price data for calculation, both aim at giving a similar price signal. The upper band and the lower band of the Bollinger band serves as overbought and oversold regions and combining RSI will help to cancel out fake signals and confirm when price is really in an overbought or oversold region.
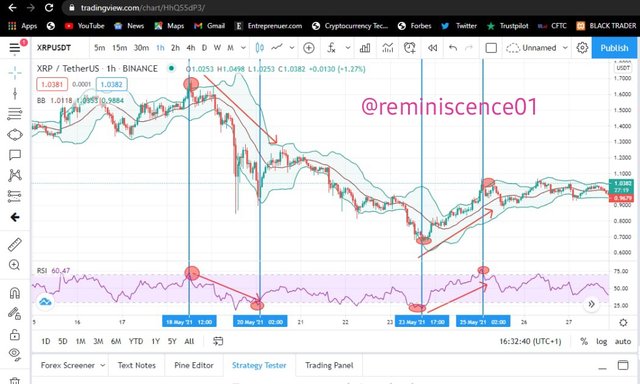
From the chart above, we can see how the RSI can be used with the Bollinger band to make a meaningful trade. We can see from the chart, the RSI is in the overbought condition above 70 and also the Bollinger band has touched the upper band which also signals an overbought condition. This is a good confluence for a trader to look for a sell entry using a candlestick reversal pattern.
Similarly, on the 23rd of May, the RSI was below 30 which is an oversold region and price is at the lower band of the Bollinger band. This is an indication that price is about to reverse in the opposite direction.
The Bollinger band and the RSI can be combined to make good trading decisions when the RSI is below 30 and price is at the lower band of the Bollinger band, this will give a good bullish reversal trade. Similarly, when the RSI is above 70 and price is at the upper band, it signals a good reversal to the downside.
A trader should make use of stoploss and candlestick analysis before taking an entry as price can remain the oversold and overbought regions during strong market trends. But the combination of these two indicators can give higher winning trades.
What timeframe does the Bollinger Band works best on? And why?
Bollinger band works best in all timeframe. It all depends on the type of trader you are and also your trading strategy. A scalper will be looking at the 1hour chart down to 15mins chart and the Bollinger band will also be plotted to suit the timeframe. On the other hand, a swing trader will be looking at the weekly, daily and 4hours chart and the Bollinger band will also be adjusted to any timeframe.
In multi-timeframe analysis, a trader can flip in between different timeframes to make better trading decisions and cancel out noise in the market.
Note: To further illustrate multi-timeframe analysis, I will carry out a multi-timeframe analysis using Bollinger band on XRP/USD chart for swing trading in the next section. This means I will be looking at the weekly, daily and 4hours chart.
Review of XRP/USD chart using Bollinger bands Indicator
In this section, I will perform a multi-timeframe analysis on XRP/USD to present various signals given by Bollinger band indicator. This analysis will be carried out on Tradingview.
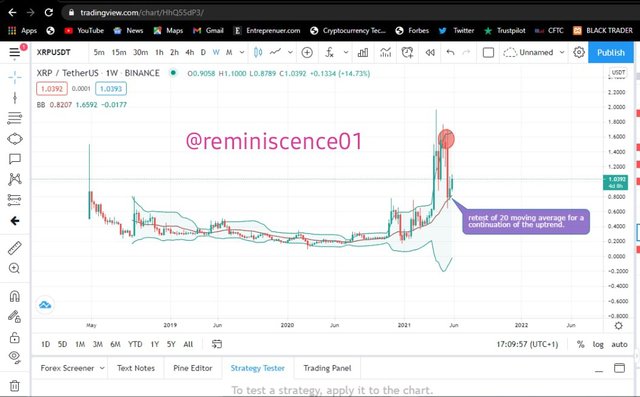
From the weekly chart, we can see price broke out of a range at $0.3 to create a high at $1.8. We can also see how price reversed after hitting the upper Bollinger band. Similarly, price has rejected the 20 moving average which is a dynamic support level for the uptrend.
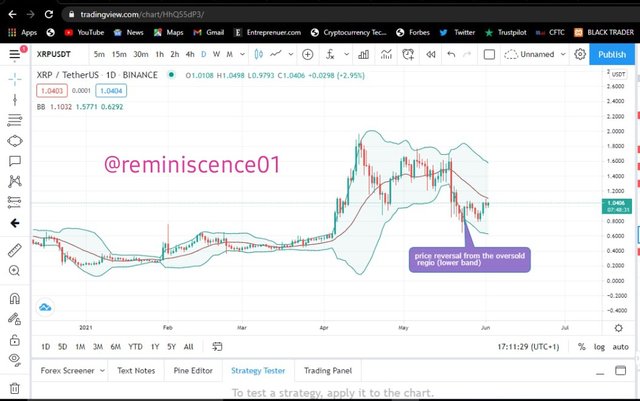
Looking at the daily chart, we can see the expansion of the Bollinger band which signal an increase in volatility of XRP. Similarly, price has rejected the lower band of the Bollinger band and is going up to continue the bullish trend.
Notice that on the weekly, price rejected the 20 moving average and reversed to the opposite direction. Now on the daily chart, we can see price reject the lower band which is also a dynamic support and have reversed back to the upside. The weekly and daily chart are indicating a bullish signal and a buying opportunity.
On the 4hours chart, price broke out on the 19th of May and formed a low at $0.64. After that, price went up to create a high at $1.05 which touched the upper band. Price was rejected and formed a low at $0.8. At this point, we can see that the trend has changed as price failed to create a lower low.
Price went back up to touch the upper band at $1.06 forming a price action resistance level. As a swing trader, the 4hour is my entry timeframe and the weekly and daily timeframe is for market direction which we have found to be bullish. Now on the 4hours, price is currently trading above the 20 moving average and I can't take a buy trade right now. I will wait for price to retest the 20 moving average which is a dynamic support before I can take a buy position.
In this section, I have performed multi-timeframe analysis to review XRP/USD chart using Bollinger band indicator. From the explanations above, there's no timeframe better to use Bollinger band. Rather it depends on a traders strategy and trading style. A trader can flip in between timeframe to get a clear picture of the market and also cancel out the noise to make a better trading decision.
In conclusion, Bollinger is a good indicator that can be used to measure the volatility of price. Bollinger bands can be used in any timeframe and it can suit any trading style. Combining Bollinger band with other indicators and technical tools will increase the winning rate of the indicator. Similarly, stoploss should be used in trading with Bollinger as sometimes false breakouts happen in the market.
Finally, no indicator is a standalone trading strategy, rather they are designed to assist us to make better trading decisions in combination with other technical tools.
Thank you professor @kouba01 for this amazing opportunity.
Twitter Promotion
Hello @reminiscence01,
Thank you for participating in the 8th Week Crypto Course in its second season and for your efforts to complete the suggested tasks, you deserve a 10/10 rating, according to the following scale:
My review :
An excellent job, well done answering all the questions with great analysis of the charts provided by tracking the price movement of the pair. Following a clear methodology and a set of accurate information enabled you to get the highest score.
Thanks again for your effort, and we look forward to reading your next work.
Sincerely,@kouba01
Thank you professor @kouba01. I have always enjoyed taking your lessons as i get to improve my technical analysis. I look forward to being part of your class.
Best regards.