Crypto Academy Week 16- Homework Post for Professor @fendit | Wyckoff Method|
.jpeg)

Wyckoff Method
The concept Wyckoff Method was developed by the famous technical analysis expert Richard Wyckoff in 1930. Wyckoff method consists of principles and laws that can be applied to the financial to make better trading decisions. This method can help a trader know when to enter a market and also identify when price is trending and ranging. During his research, Wyckoff developed series of principles and theories that valid in today's technical analysis. These includes :
- The composite man.
- The three fundamental laws.
- The Wyckoff's 5-step approach.
The Composite Man
To better understand the movement of price in the market, Wyckoff proposed the idea of composite man as an ideal market whose operations, movement and fluctuations are controlled by one man. The composite man sits on his screen and manipulates the market to his advantage. Wyckoff added that, if the game of the composite man can be understood, this will be an added advantage to make a profit in the market.
According to Wyckoff, the strategy of the composite man can be identified on the chart and can be predicted. Retail traders who understand the game of the composite can learn from it and take advantage of the market. The composite man's strategy revolves around a market cycle which Wyckoff identified to be in four phases. These cycles are dependent on detailed information on supply and demand which can be derived from studying price action, volume and time. Understanding these market phases will help a trader get good entry and exit timing in the market. The four market phases include:
- Accumulation
- Uptrend
- Distribution
- Downtrend.
Accumulation
In this phase, the composite man accumulates assets before other investors come in. During this phase, the volatility and volume are low as we see price range for a certain period. The composite man carefully and gradually accumulate assets during this phase and avoid price to get out the range. This can be seen by price not breaking a previous low point.
Uptrend
The composite man has accumulated enough assets which will deplete the supply of the asset. The composite man tends to push price upward to get the attention of other investors in the asset he has already acquired enough quantity. As the volume of the asset increase, more investors get excited and jump in as well and this will skyrocket the price to the upside. This simply happens because the demand for the asset is greater than the supply.
Re-accumulation phases also occur during an uptrend. This is as a result of partial profit-taking from the composite man to generate liquidity from the retail traders. After the, we see a continuation of the trend. The uptrend will continue after the re-accumulation phase until fails to create a new high after the pullbacks. An example can be seen below.
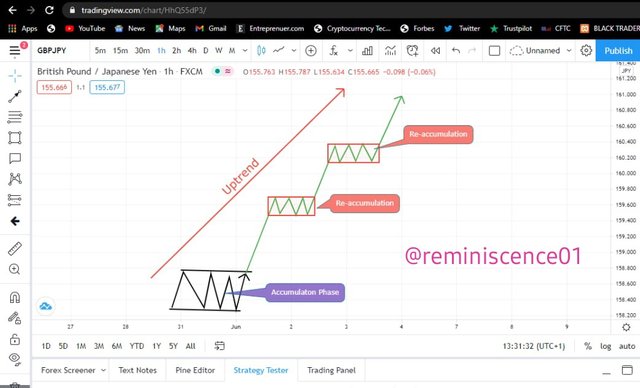
From the chart above, we can see how price broke out after the accumulation phase to start an uptrend. Also, during this uptrend, there's a minor pullback for price to continue the uptrend. The uptrend will come to an end only when the re-accumulation phase failed to create a new high. Then the market is expected to enter the next phase to be discussed which is the distribution phase.
Distribution Phase
As more investors get excited and jump into the market due to fear of missing out (FOMO), this causes demand to excessively higher than supply, thus pushing price higher. During this period, the composite man has already accumulated enough profit because he entered the market before every other person and he is also holding large positions. This time, the composite man decide to take profits by selling his positions to those who entered the market due to FOMO.
During this period, we see the market ranging again as the excessive demands are being absorbed. This causes those who entered the position late to be stopped out in the market.
Downtrend
After the composite man has finished selling his assets, due to his large position which influences the market. Price tends to make downward moves as the composite man pushes price down. Again, other investors have noticed a change in the direction of the trend and they closed their long positions to open a short position. Again the supply becomes greater than demand and price start trending down.
Similar to the uptrend, we also have a re-distribution phase in the downtrend which is caused by a minor pullback to allow other investors to buy what is called the dip. After that, the downtrend continues until a new low is failed to be created after a re-distribution phase. When this happens, a new accumulation phase begins and the composite man keeps repeating these cycles. An example can be seen below.
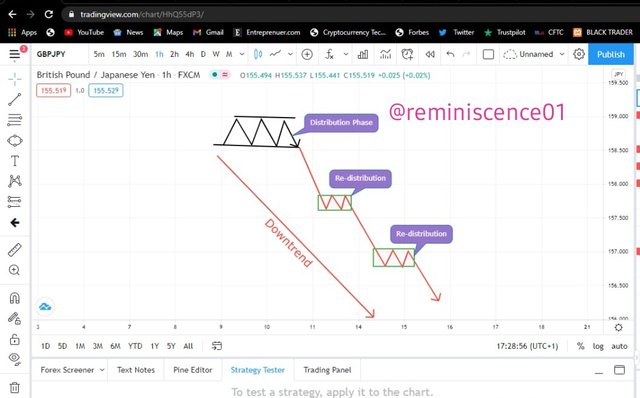
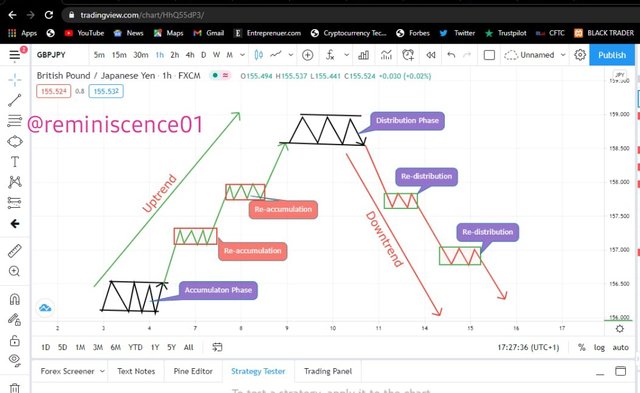
From the chart above, we can see how the Wyckoff composite man's cycle and how it keeps repeating in the market.
Finally, With the understanding of the composite man, a trader can be alerted on the beginning of an uptrend and a downtrend and also know when the trend is about to change to exit the market. Traders can also the composite man for good risk management and minimise losses.
The Fundamental Laws
Wyckoff method is based on three fundamental laws that can be used to determine the market potential direction and also the current state of the market.
The law of Supply and Demand
This law is one of the bases and foundation of the Wyckoff method. When the demand for an asset is greater than the supply, price rises. Similarly, when the supply of an asset is greater than the demand, the price decreases. A trader can study and balance the demand and supply of an asset by comparing the change in volume bars and price. As more people start purchasing an asset, the demand of the asset increases more than the supply and this causes price to increase and start an uptrend.
From the composite man we discussed earlier, we can see how the understanding of the supply and demand of an asset can play a crucial role in determining the direction of the market.
The law of Cause and Effect
Just like we have discussed in the law of demand and supply. When price accumulates, there's a struggle and imbalance between supply and demand, after which demand exceeds supply as more people start buying the asset which causes the price to start an uptrend. The period of accumulation is the cause and the corresponding uptrend is the effect. Similarly, the distribution period is the cause whose effect is the downtrend as supply exceeds demand.
Charting techniques and other tools can be used to determine how far price can travel when it breaks out of the accumulation zone and this can help set profit targets and exit points in the market.
The law of Effort and Result
This law explains the relationship effect of the relationship between price action and trading volume. Price changes in an asset happened as a result of an effort represented by the trading volume. For example, an asset will continue in its original trend if there's no divergence between the volume and the price action. On the other hand, if there's a divergence between price action and the volume of an asset, the market tends to reverse to the opposite direction or consolidate.
My Point of View
The Wyckoff method shows a detailed and clear view of price movement using the concept of demand and supply and also the volume in the price of an asset. The idea of the composite man clearly illustrates the market cycle which can enable a trader to recognise future market directions.
Similarly, the idea of the Wyckoff method can allow a trader to make informed trading decisions which cannon turn increase the profitability of trades. Similarly, incorporating the Wyckoff method, an investor avoids market manipulations and be on the safe side of the market.
Though the method proved to be helping in making trading decisions, one should also be aware of the market situation by clearly understanding the current market trend. Though new traders might not have the discipline to apply this method due to the volume of their trades. But it is necessary to understand predict and know the next push phase of the market.
Technical Analysis on REEF/USD: Wyckoff Method
In this section, I will perform technical analysis on REEF/USD to illustrate Wyckoff method. This analysis will be carried out on Tradingview platform.
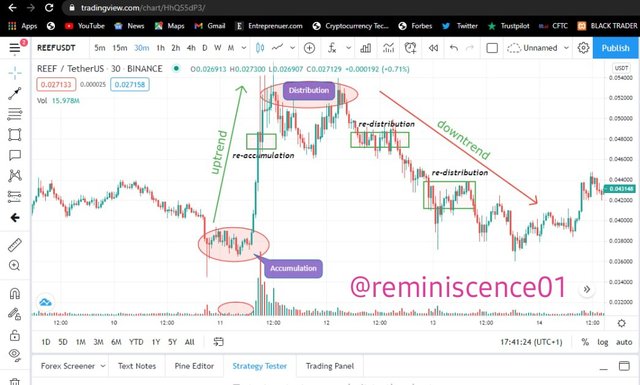
From the chart of REEF/USD above, we can observe Wyckoff method and the composite man cycle.
Accumulation
From the chart above, we can see a consolidation of price after a downtrend. The market failed to create a new low which shows that the bearish trend is weak and the trend is about to reverse. During this period, the volume of price was very low as we can see very short candles printed. This is the accumulation phase where the composite man is accumulating REEF before other investors come in.
Uptrend
After the composite man has accumulated enough REEF, he pushed the price upward to get the attention of other investors. After that, more people jump in to accumulate REEF which increases the demand of REEF to excessively exceed the supply. This increase the trading volume in the price of REEF which pushed price into an uptrend. We can also see that as the volume bars get longer.
Price created a high at $0.052 and retrace down to $0.046. This is as a result of minor profit taking by the composite man who gives other investors the chance to buy the dip. This little pullback created the re-accumulation phase for price to continue the uptrend.
Distribution
After the re-accumulation phase, price continued up to create a new high. After that, price pulled back creating another re-accumulation phase for price to continue the uptrend. From what we see on the chart, failed to create a new high which shows that the uptrend is over and we are about to enter the distribution phase. Here the composite man has made enough profit and he is closing his positions by accumulating excessive demand of investors who got in during the re-distribution phase. Price was in a range as we see the volume decrease. After accumulating the excessive demand in the market, the competent man pushed price a little down to $0.048 to start the next phase which is the downtrend.
Downtrend
After the composite man has pushed price lower, other investors saw this as a reversal and closed their open positions at loss to open a short position to avoid missing the downtrend. They jump in on REEF which causes an increase in supply over demand. This led to a downtrend as the price of REEF declined. Similarly, there was a pullback that created a re-distribution phase due to partial profit-taking for more investors to take short positions.
From the chart above, the distribution phase started when the re-accumulation phase failed to create a new high which started the beginning of the distribution phase. Similar, the downtrend will be over for an accumulation phase when the re-distribution phase failed to create a new low.
In conclusion, the Wyckoff method isn't just an ideal theory. This is a method that has been proven and used by professional traders. It is a great tool to understand price movements and future market direction.
Similarly, the understanding of Wyckoff method can be used to avoid getting trapped in market manipulation and can also be used to enter the market at the right time. Thank you professor fendit for this amazing lesson.
Twitter Promotion
Congratulations! Your post has been selected as a daily Steemit truffle! It is listed on rank 20 of all contributions awarded today. You can find the TOP DAILY TRUFFLE PICKS HERE.
I upvoted your contribution because to my mind your post is at least 6 SBD worth and should receive 26 votes. It's now up to the lovely Steemit community to make this come true.
I am
TrufflePig, an Artificial Intelligence Bot that helps minnows and content curators using Machine Learning. If you are curious how I select content, you can find an explanation here!Have a nice day and sincerely yours,

TrufflePigThank you for being part of my lecture and completing the task!
My comments:
Loveeeeeeed it!!!
Nice work, everything was superb. Explanations were really good, the chart shows VERY clearly the method and you analysis was really interesting. Congrats on such good work! :)
Overall score:
10/10
Thank you Professor @fendit.