Crypto Academy Week 15- Homework Post for Professor @yohan2on on Swing Trading


Swing Trading
Unlike Scalp trading and day trading that revolves within a trading session, Swing trading involves holding positions for more than one trading session ( more than 24 hours). Due to market movement in a zig-zag pattern, price tends to create higher highs and higher lows in an uptrend, and lower highs and lower low in a downtrend. Swing trading aims to capture these market swings ( highs and lows of price) and this can last for a couple of days and maybe more than a week.
Swing trading involves primarily technical analysis to mark out entry and exit points in the market. This involves the use of multi-timeframe analysis, candlestick patterns, chart patterns, technical indicators. A swing trader set up a plan and strategy using these technical setups to have an edge in each trade. In the rest of this post, we will carry out technical analysis to demonstrate Swing trading on a cryptocurrency pair.
Technical Analysis for Swing Trading
For this section, I will carry out a swing trading on TRX/USD pair on Tradingview platform. This analysis will be based on multi-timeframe analysis, candlestick analysis, chart patterns, technical indicators to find potential swing trading opportunity as well as entry and exit strategy.
Trading plan:
Multi-timeframe analysis: In this analysis, I will deploy multi-timeframe analysis to support my trading decision. Multi-timeframe analysis plays a role in identifying the current market trend from the higher timeframe down to the lower timeframe. Similarly, a multi-timeframe analysis helps to cancel out noise in the lower timeframe to avoid counter trending.
- Monthly timeframe, weekly timeframe and daily timeframe will be used to determine the direction of the market and also find relevant support and resistance levels.
- After we have established these levels and know the market direction, we will use the 4hour and 1hour timeframe for entry opportunity
Candlestick analysis: For candlestick analysis, I will be looking out for chart patterns to identify market trend and also reversal patterns. I will also deploy candlestick patterns for our entry strategy.
- higher highs and higher lows formation, trend lines will be deployed for identifying market trends.
- Double top, double bottom, head and shoulder pattern, ascending and descending triangles will be deployed for identifying trend reversals and continuation.
- for entry, engulfing candles, hammers, Doji candles at support and resistance levels will be used to support our entry after identifying market direction using a higher timeframe.
Technical indicators: 200-period moving average will be used to determine the market trend. Similarly, the Fibonacci retracement tool will also be used to spot potential reversal spots.
Trade management:
- Stoploss will be placed below recent swing highs and swing lows ( or support and resistance levels).
- Take profit will be at the nearest support and resistance level and a target of 1:3 risk-reward ratio.
Note
- The above trading plan listed are my personal trading plan which I will deploy in this analysis.
- Trading decisions will be strictly based on support and resistance levels. The reason is that support and resistance levels are areas of market buying and selling pressure and there are high chances that price will reverse or continue in its direction when it gets to this level.
Analysis on TRX/USD
Monthly chart

From the monthly chart, we have been in an uptrend since January 2021 after the price broke a resistance level now turned support at $0.035. Similarly, the price continued trading up and broke a resistance level at $0.092. This is the highest level price have reached this level since April 2018. I consider this a fake breakout because the next candle has broken back into the resistance area and have engulfed the previous candle. We might expect the price to retest the support at $0.035 before continuation to the upside.

Plotting Fibonacci retracement on the monthly chart to determine the possible price reversal, we can see that the 0.5 and 0.618 of the Fibonacci levels are in line with the resistance area at $0.092 and these fibs levels are considered major reversal levels. But currently, we see price has rejected the 0.78 fibs level.
In conclusion, price has broken back into a resistance level which shows strong bearish pressure. We might see price go down further to retest the support level at 0.035.
Weekly Chart

From the weekly chart, we can see price reject at a support level as the previous candle failed to close below the support. From what we noticed here, a break below this weekly support will push price down to the monthly support area at $0.035. Also, we can expect a reversal at this point due to the rejection of the weekly support.

Plotting Fibonacci retracement to determine price reversal, we can see that the 0.786 fibs level in line with the weekly support. One good way to read the Fibonacci retracement tool is to combine it with support and resistance levels. And from what we have here, price has rejected a support level and we can also see that rejection on the 0.786 fibs level which gives us an idea of a possible market reversal.
But this information on the weekly and monthly chart isn't clear information to look for an entry as we already have strong bearish candles. Now we will go down to the daily chart to see price reaction at the weekly support level before we can look for an entry on the 4hour chart or 1hour chart.
In conclusion, possible reversal to retest the broken resistance on the monthly chart at $0.092.
Daily Chart
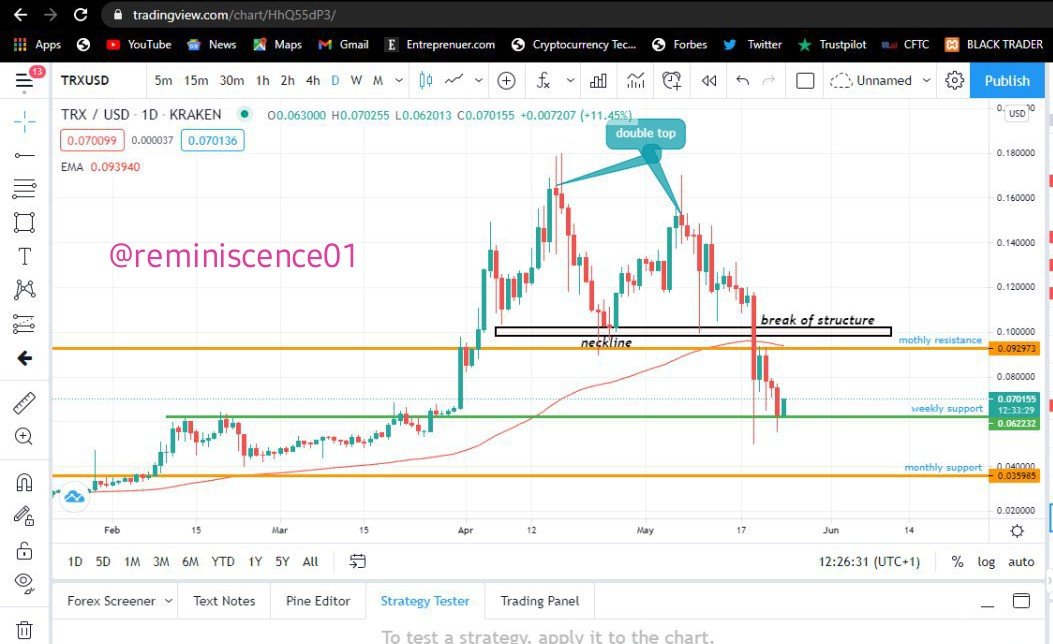
From the multi-timeframe analysis carried out, It is clear that we have a selling pressure in TRX/USD based on the monthly and weekly chart. On the daily chart, the bearish pressure is very clear with multiple confluence. This includes
- we have a double top formation which is a reversal pattern which is a reversal signal.
- We have a break of structure as price has broken the neckline of the double top formation. This is also a reversal pattern as we expect to see price make a lower low formation
- Also, we have seen price has broken below the 200 period moving average which shows that the trend has changed from bullish to a bearish trend.
Now, each time there's a break of the double top neckline, price tends to retest this neckline for a continuation of the new downtrend. And also notice that this neckline is the resistance level on the monthly and weekly chart price is expected to retest for the continuation to the downside.

From what we have established, there's selling pressure on the price of TRX. Looking to buy now means trading against the trend (counter trending). But we can also take a buy position to target the neckline and resistance level at $0.092. The risk-reward ratio is just 1.74 which doesn't worth it for a swing trader. This means risking $1 for $1.74. So it is advisable to be patient for the price to retest this resistance and then look for a sell entry based on candlestick reversal pattern. This can be a bearish engulfing candle or an inverted hammer at the resistance.
4 Hour Chart

From my entry timeframe (4 hour), I will be waiting for price to retest the resistance level and then enter a position based on a bearish engulfing candle or an inverted hammer. The first profit target will be the weekly support level at $0.062 and the second profit target at the monthly resistance at $0.035. Stoploss will be placed above the resistance level at $0.102. The risk-reward ratio will be 1:3.
Though the market is full of uncertainties, price can also break this resistance level and continue going up. This is why it is advisable to use candlestick reversal patterns before entry. If price should break the resistance at $0.092. I will change my bias from bearish to bullish. This can be illustrated in the chart below.

From the chart above, if price should break the resistance level at $0.09, there's a possibility that the downtrend has been invalidated. If this happens, we can see an up movement to the next resistance at $0.162. My entry will be based on a break and retest of the resistance level as shown in the chart above. Then after that, I will wait for a bullish candlestick pattern to take an entry. Stop loss will be placed few points below the resistance level and take profit target will be the next resistance at $0.162 with the first profit target at $0.120.
In conclusion, trading is all about planning and also having patience for your plans to play out. In this post, I have carried out a technical analysis on TRX/USD for swing trading. Multi-time frame analysis, chart pattern, candlestick, moving average, Fibonacci retracement tool were deployed to support my analysis. I will currently be monitoring this pair to execute my plan when my plan plays out. Swing trading is the best trading style for me because I don't spend much time looking at the market. Also, the risk-reward ratio in swing trading is higher and the trader avoids the risk of overtrading just like in scalping style.
Thank you professor @yohan2on for your wonderful lesson and also, the opportunity to learn a new trading style.
Twiiter Promotion
Hi @reminiscence01
Thanks for participating in the Steemit Crypto Academy
Feedback
This is excellent work done. You have demonstrated your understanding of Swing trading in a clear and detailed way. Keep it up!
Homework task
10
Thank you professor @yohan2on.
Good day professor @yohan2on. Please i made a mistake and sent Steem to a wrong user. I was trying to send Steem to @huobi-pro but i made a mistake and sent to @houbi-pro.
This account is dormant and i want to know if i can recover the funds?
So sorry about that 😐😞. The fact is that you just sent your steem to a scam account. Such an account was created by an anonymous steemit user to just take advantage of any mistake made by anyone on steemit while transferring funds to Huobi exchange. I highly doubt whether you can recover your funds.
@huobi-pro strongly warns anyone depositing steem to its exchange to be so kin at the account address @huobi-pro and the tag, otherwise missing out any of those 2 credentials can just lead to a permanent loss of funds. Recently I also made an error when I sent to the right address @huobi-pro and just skipped out the tag224832. I lost my funds just like that.
Alright professor @yohan2on. I will be very careful next time. I'm sorry for your loss of funds.