Crypto Academy Week 14- Homework Post for Professor @kouba01| Cryptocurrency Trading with MACD Indicator
Hello Steemians, Welcome to week 14 of Steemit Crypto Academy. Today's lesson is delivered by professor @kouba01 on 'Cryptocurrency Trading with MACD'. In this lesson, we were introduced to a powerful technical indicator that can help us increase our trading experience. In this post, I will be performing my homework task based on my understanding of the topic.
.jpeg)

What is MACD indicator simply? Is the MACD indicator Good fo Trading Cryptocurrencies? Which is better, MACD or RSI?
MACD which represents "Moving average convergence divergence" is a powerful trend-based momentum technical indicator used to find trends in the price of an asset. This indicator analyses the momentum in the price of an asset based on historical data to indicate whether the current trend is up or down, and this, in turn, generate signals and trading opportunities for traders.
Is MACD indicator Good for trading Cryptocurrency?
It is no doubt that MACD is a good indicator for trading cryptocurrency. The cryptocurrency market is highly volatile with price always trending. MACD being a trend-following indicator can be used to identify these trend in crypto assets. Also, MACD can be used to find potential trading opportunities by generating signals to enter a position. There's this slogan " the trend is your friend". Identify trends in the market is the ultimate priority of any crypto trader and MACD is the perfect indicator to identify trends in crypto assets.
Which is better, MACD or RSI?
In our previous lesson, we discussed about the RSI indicator as also a momentum based indicator used to ascertain when the price of an asset is overbought or oversold for a potential price reversal by measuring price changes in relation to recent highs and lows of price. MACD on the other hand measures the relationship between two moving averages of price to give an idea of the current trend. These two indicators different factors to identify trading signals. MACD is suitable for any trading style and also any time frame. Why the RSI signal depends on the overbought and oversold regions, the MACD gives trading ideas based on MACD line and Signal line cross. This is more simple and easy to identify new trends and trend reversals than the RSI. Sometimes the RSI remains in overbought conditions and oversold conditions as the price of an asset continucontinueng up, but with MACD, you can easily identify these strong trend based on the divergence of the MACD line and Signal line. Also, a trader can know when a trend is coming to an end when the MACD line and Signal line converges. Incorporating these two indicators won't be a bad idea as both measures different price factors to give a signal on momentum. Also, this can help to filter out false signals.
How to add the MACD indicator to the chart, what are its settings, and way to benefit from them? (Screenshot required)
In this section, I will illustrate how to add MACD indicator on the Tradingview chart. The steps are as followed.
Steps
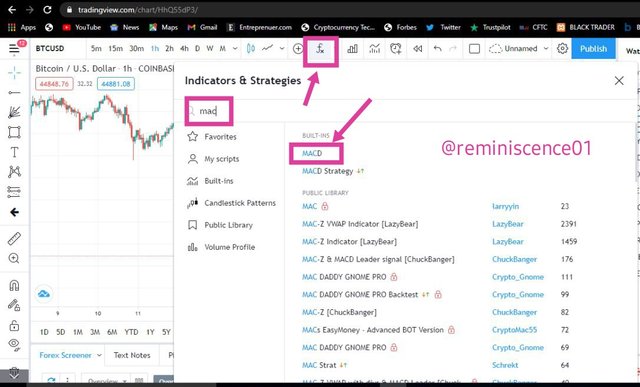
- On Tradingview Chart. Click on the indicator icon at the top of the page.
- After that, the indicator landing page shows up. You can easily access an indicator by using the search bar. Now on the search bar, type MACD. All the available built-in MACD indicator pops up, click on the first one "MACD". This can be illustrated in the screenshot below.
MACD Settings
After you have successfully added MACD to your chart, click on the settings icon to configure MACD to suit your trading style. In the picture below, we can see the default settings of MACD.
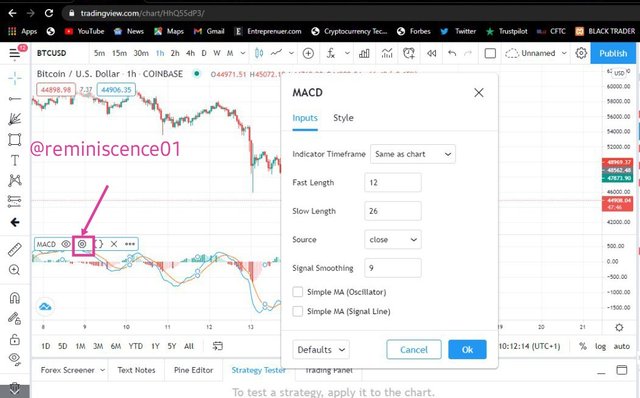
From the picture above, we have three numbers which are the key settings of the MACD indicator.
- The fast length is the number of periods used in the faster-moving average which in this case is 12 by default.
- The slow length is the number of periods used in the slower-moving average which in this case is 26 by default.
- The signal smoothing represents the number of bars used to calculate the moving average of the difference between the fast length and the slow length. The default settings for this is 9.
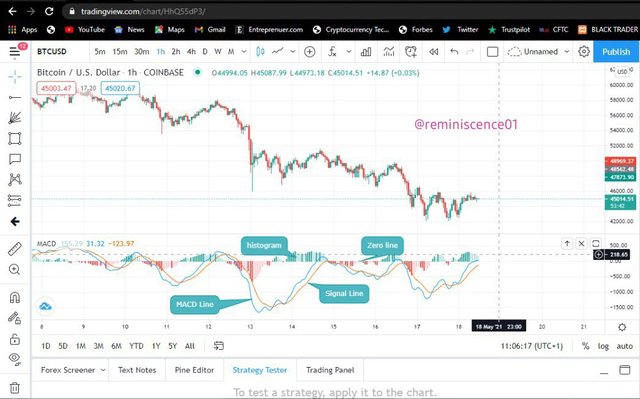
Now on the MACD chart, we have two lines and a histogram. These two lines are not moving averages, rather the MACD line and the Signal line.
MACD Line (Blue line)
MACD line is the difference between two moving averages (usually EMAs). The MACD is considered as the faster moving average which measures the difference between the 12 period moving average and the 26 period moving average.
MACD = 12 period EMA - 26 period EMA
Signal Line (Yellow line)
The signal line is considered the slower moving average which is the moving average of the MACD line. By default, the 9 period moving average is used for the signal line.
Signal line = 9 EMA of MACD value
Histogram
The histogram is the graphical representation of the difference between the MACD line and the signal line. The histogram measures the distance between the MACD line and the signal line and gives an early signal when a crossover is about to happen. The histogram is located close to the zero line and traders can use the histogram to detect price reversals or weak trends. When MACD line crosses the signal line, the histogram reduces to the zero line which signals a price reversal.
Zero line
The zero line is the midpoint of the histogram. When there is a cross between the MACD line and the signal line, the histogram approaches the zero line which signals a trend reversal. Traders can use this to detect price reversals by looking at the histogram.
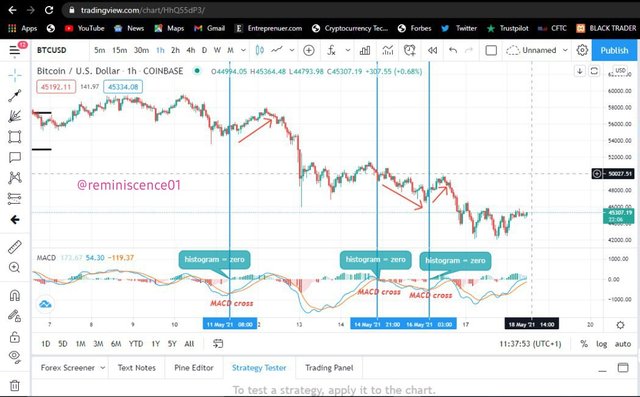
The picture above shows the relationship between the MACD, histogram and zero line. We can see how the histogram slowly approaches the zero line when the trend gets weaker and it's equal to zero during trend reversals (MACD cross). For a bullish reversal, we see the histogram cross above the zero line when there is MACD cross and during bearish reversal, we see the histogram cross below the zero line when there is MACD cross.
These lines explained above can help a trader indicate trend reversals and also know when a trend is getting weak. That is when the MACD line and the signal line converge and this is reflected on the histogram as it approaches the zero line.
How to use MACD with crossing MACD line and signal line? And how to use the MACD with the crossing of the zero line?
Using MACD with crossing MACD line and signal line
In this post, we have established the elements of MACD and the settings. Now we are going to discuss how we can use the MACD cross to make trading decisions.
For a bullish reversal, when the MACD line crosses above the signal line, this indicates a shift in momentum to the upside and price reversal. Traders can use this cross as a buy signal to look for a buy position. An example is shown on the BTC/USD chart below.
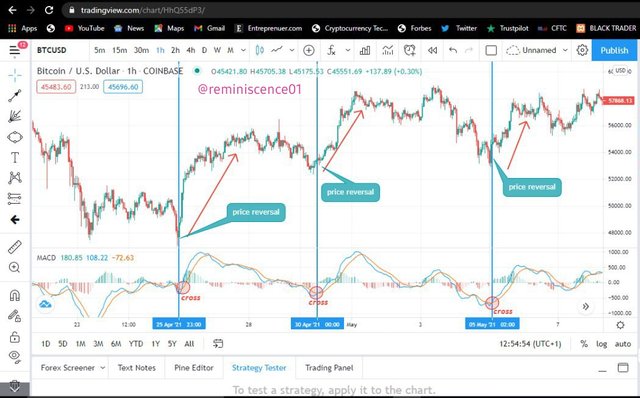
From the chart above, we can see price reversals indicated as the MACD line crosses above the signal line. Traders can take advantage of this signal for a buy entry. Similarly, we can also see the reflects of this cross on the histogram. Notice how the histogram changes to the positive side when the MACD line crosses above the signal line. A trader can also decide to focus on the histogram to find trend reversals.
For a bearish reversal, when the MACD crosses below the signal line, it is indicating a sell signal and a reversal to the downside. An example of a bearish reversal signal of MACD cross can be shown on STEEM/USD chart below.
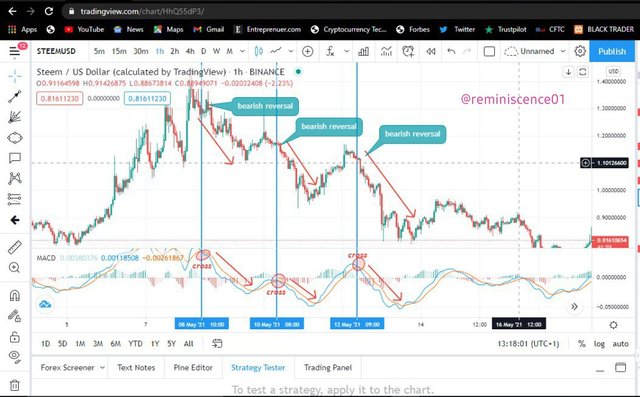
The chart above shows how we can spot bearish reversals using MACD. From the chart, after STEEM/USD rallied to a high of $1.41, there was a cross of MACD line below the signal which indicates that the trend is weak and a potential reversal in the price of STEEM. Also, after the reversal, we see price creating lower low formations and again we see the cross of MACD line below the signal line for price to continue in its original direction.
Using MACD with crossing of Zero line
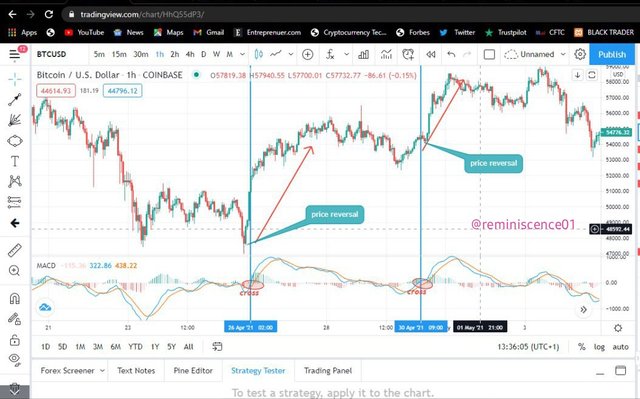
Crossing of the MACD and the zero line is another interesting thing to watch out for as this can also give trend reversal signals. The zero line represents the midpoint of MACD. When the MACD crosses above the zero line, this indicates a buy signal and a reversal of price to the upside and this crossing correspond to the crossing of the 12 period EMA above the 26 EMA. An example of a buy signal using MACD crossing above the zero line can be seen on the chart of BTC/USD below.
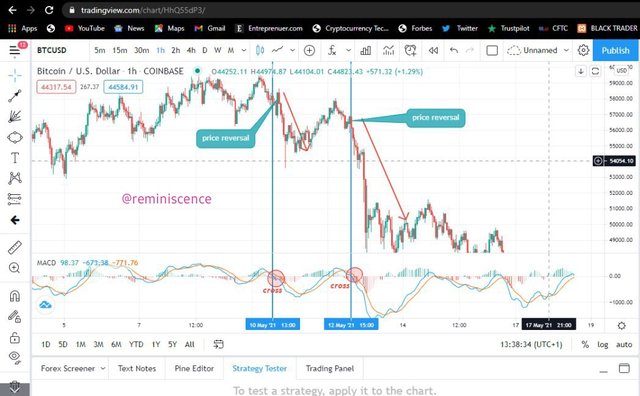
Similarly, when MACD crosses below the zero line, this indicates a sell signal which corresponds to the crossing of 12 period EMA below the 26 period EMA. Traders can also use this crossing for a sell opportunity. An example is shown on the chart of BTC/USD below.
How to detect a trend using the MACD? And how to filter out false signals? (Screenshots required )
How to detect trend using the MACD
The MACD indicator can be used to detect trends in the market. The divergence and convergence of MACD line and signal line can be used to identify strong trends in the market. When the MACD line diverges away from the signal line after crossing above it, it indicates a strong bullish trend in the market. Similarly, when the MACD line converges to the signal line, this indicates exhaustion of trend. The chart below shows how MACD can be used to detect strong trends in the market.
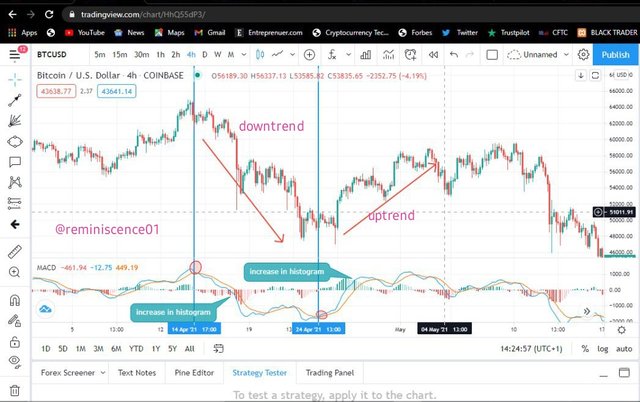
Also, the MACD histogram can be used to detect trends in the market. When a new trend is about to start, we tend to see the histogram increasing. This increment of the histogram can be used to detect a new trend in the market. From the chart above, we can see the expansion of the histogram after the MACD line crossed below the signal line, the histogram cross below the zero line and started increasing. That is an indication that the trend has changed from bullish trend to bearish trend.
Filtering false MACD signals
Indicators don't give a sure signal to enter the market. Sometimes they give false signals and can make a trader trade against the trend. MACD is a lagging indicator and having this idea will prove to you that ot doesn't always give accurate signals.
Sometimes we experience a crossover of the MACD line over the signal which is a bullish reversal, but we tend to see the price going in the opposite direction with the MACD signal. The best way to filter this signal is the use of divergences. Divergences can help to filter out false MACD signals and make them a good signal. Below is an example of bullish divergence on XRP/USD chart.
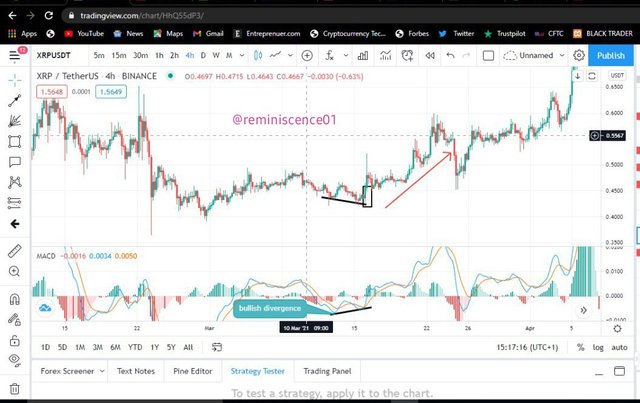
From the chart above, we saw price make a lower low formation while the MACD makes a lower high. This can be seen as a false signal but the use of divergence can help to filter this signal and understand that price is about to reverse to the upside and that is exactly what happened.
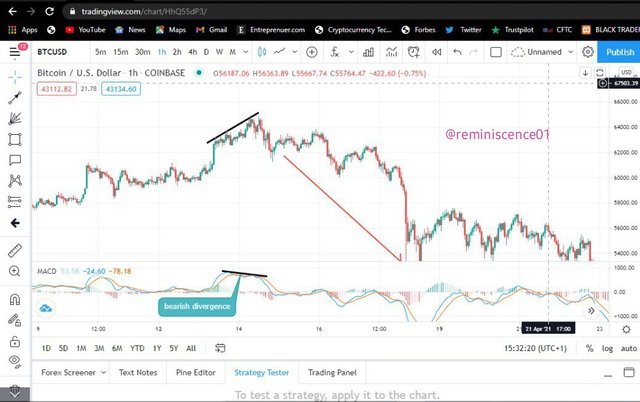
The chart above shows bearish divergence spotted in BTC/USD pair. We can see the price created a new high while the indicator did the opposite. This can be seen as a bearish reversal signal. Another alternative way of filtering false MACD signal is to combine it with another momentum-based indicator like the RSI or stochastic.
How can the MACD indicator be used to extract points or support and resistance levels on the chart? Use an example to explain the strategy. (Screenshot required)
Support and resistance points are areas of buying pressure and selling pressures. This equally means that it is an area of price reversals on the chart. We have already established how we can use MACD to spot reversals in the price of an asset. This can be the MACD line crossing over or below the signal line. These areas of crossovers can be traced on the chart to serve as support and resistance points on the chart.
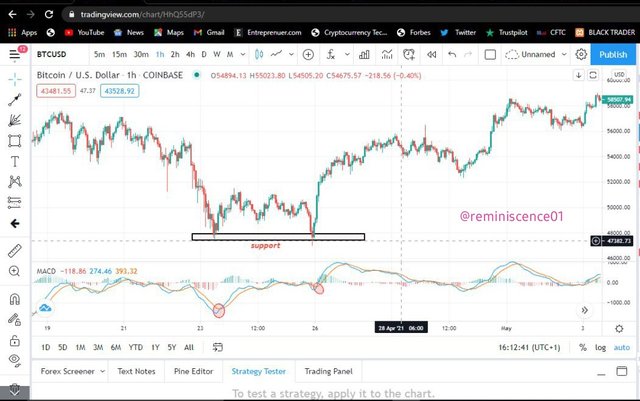
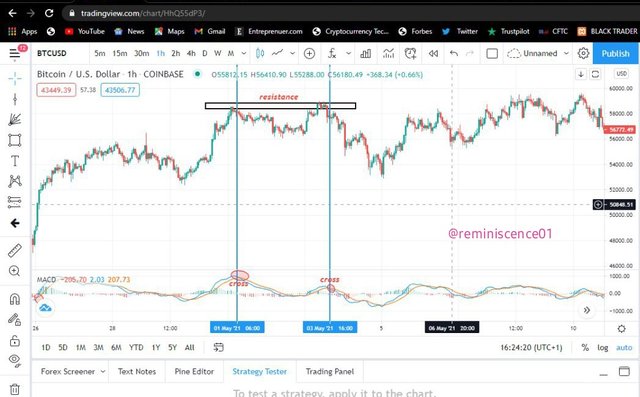
From the chart above, there was a reversal as the MACD line crossed above the signal line to form a low point. This low point can serve as an area of support when next price approaches it. After two days of price reversing from that point, price came back exactly on the area to retest the support. From the MACD chart, we saw a cross of MACD line above the signal line as price retested the support. Similarly, there was a cross of MACD above the zero line which indicated that price is going to reverse at the support. And after that, we saw price rejected at the support and continue going up.
The chart above shows how we can use MACD to extract resistance points on the chart. Notice how price reversed after MACD line crossed below the signal line, a high point was created on the chart which serves as a resistance point. A few days later, price came back to retest this resistance area and there was a reversal. Also, notice how the MACD line crossed below the signal after price retested the zone again. This formed a resistance point and saw price reverse in the opposite direction.
Review the chart of any pair and present the various signals from the MACD. ( Screenshot required)
In this section, I will be analysing XRP/USD pair using MACD indicator.
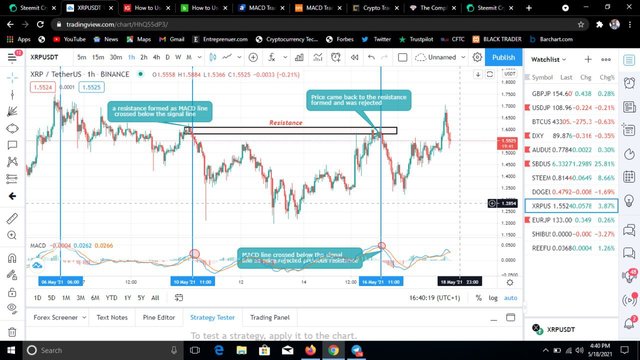
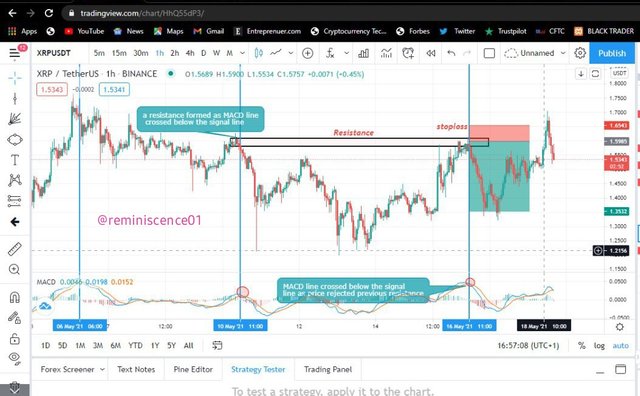
From the chart above, we can see price reversal as the MACD line crossed below the signal line, this signal a bearish reversal. This point of reversal created a resistance point on the chart. After few days, price came back to this resistance area and was rejected. Similarly, the MACD line crossed below the signal line which that price will reverse at the resistance line. In this review, we have seen how the MACD has served as a reversal signal and also helped us point area of resistance level which we can expect price reverse in the future. A good entry opportunity will be seen as MACD line crosses above the signal line with stoploss placed above the high point of the resistance area. This will be perfect trade with a 4.4 risk-reward ratio. This can be shown in the picture below.
From what we have currently on XRP/USD, we can see price rejected at a previous resistance area where MACD line previously crossed below the signal line, though price is rejecting this area, but MACD line hasn't crossed below the signal line to show a sell signal. We can only consider taking a sell when MACD has crossed below the signal line.
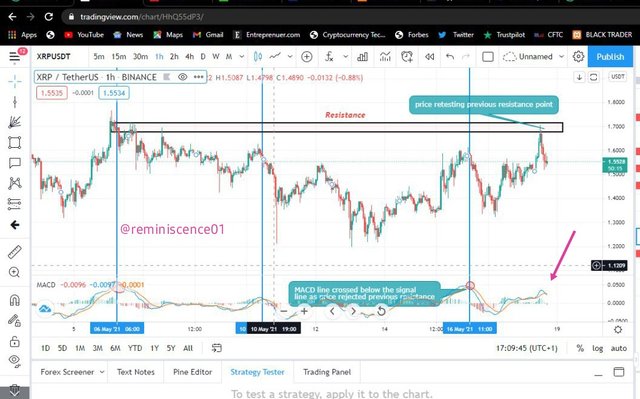
I observed MACD is lagging behind price because we have already seen a rejection in price but MACD haven't indicated any bearish reversal. Maybe when it does, price has already extended further making stoploss very wide.
In conclusion, MACD is a good indicator that can help detect trend reversals and opportunities in the market. But the success rate of using this indicator will be high if paired with other technical tools like candlestick analysis, chart patterns, support and resistance. This can help to filter out false signals and also know when the indicator is lagging.
Thank you professor @kouba01 for this wonderful opportunity.
Twitter Promotion
Hi @reminiscence01
Thanks for your participation in the Steemit Crypto Academy
Feedback
This is Excellent work done. Thanks for such a detailed explanation and practical demonstration of the MACD trading indicator.
Homework task
10
Thank you professor @yohan2on.
Congratulations! Your post has been selected as a daily Steemit truffle! It is listed on rank 18 of all contributions awarded today. You can find the TOP DAILY TRUFFLE PICKS HERE.
I upvoted your contribution because to my mind your post is at least 10 SBD worth and should receive 22 votes. It's now up to the lovely Steemit community to make this come true.
I am
TrufflePig, an Artificial Intelligence Bot that helps minnows and content curators using Machine Learning. If you are curious how I select content, you can find an explanation here!Have a nice day and sincerely yours,

TrufflePig