Crypto Academy Week 14- Homework Post for Professor @fendit on Elliot Wave Theory (EWT)


What's the application of this theory?
Elliot wave theory was invented by a professional accountant named Ralph Nelson Elliot after he studied 75 years of stock data. According to his findings, Ralph discovered that the market is traded in repetitive patterns which occur due to traders psychological and sentiments about price. These repetitive patterns occur due to the psychology and emotions of traders.
The upward and downward swings of price creating higher highs and higher lows always repeat themselves in the market due to the psychology and emotions of traders. Technical trading is mostly based on patterns recognition and traders psychology and emotions always arouse when these patterns occur in the chart. Let's take, for example, a double top formation at a resistance level is an indication that price will reverse in the opposite direction. This pattern is a common pattern and every other trader has this same psychology. They tend to close their long position when the price forms a double top at resistance and this causes the price to reverse.
Now using Elliot waves theory, traders can identify and ride potential trends by having good information about the direction of the market. This theory is not an indicator or an entry strategy. Rather, it gives you detailed information about the highs and tops of price. This can help a trader to buy low and sell high in a bullish market and also know when a trend is weak. Similarly, this theory will help a trader to avoid unnecessary losses by jumping into a position at a higher price when everyone is taking profits.
What are impulse and corrective waves? How can you easily spot the different waves?
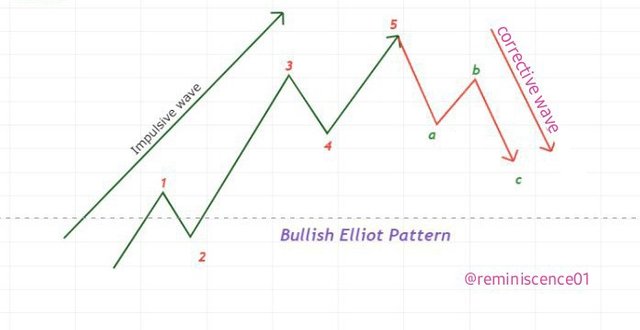
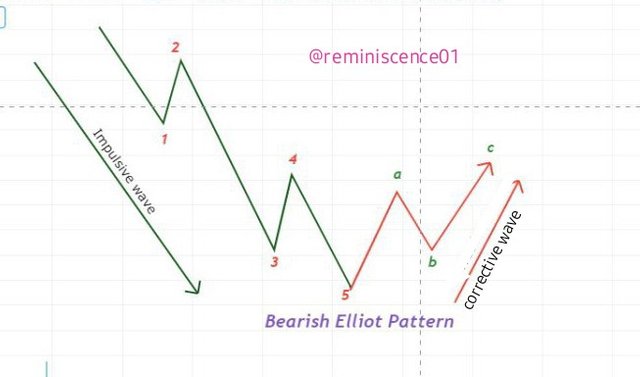
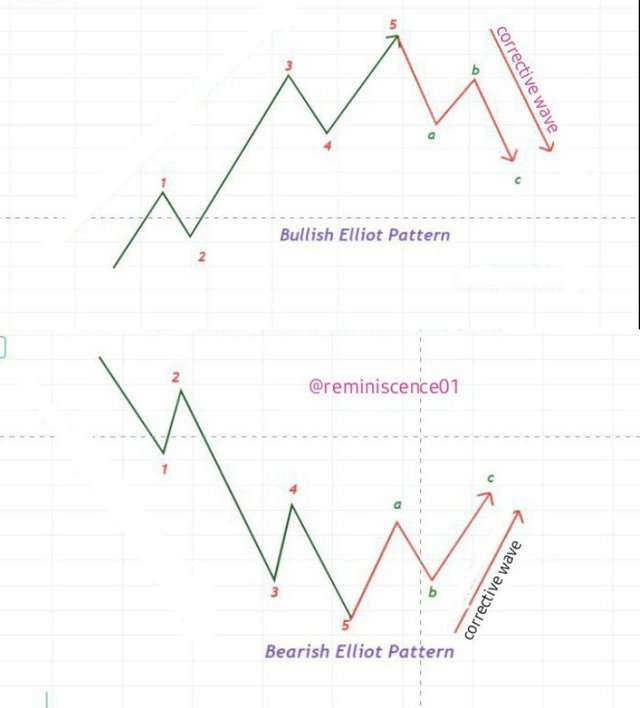
According to Elliot, the wave patterns can be identified in the market based on the characteristics of their formation. These waves can be categorised into Impulse or Corrective waves. The impulse waves tend to move with the market overall trend while the corrective waves move in the opposite direction to the market trend. These patterns can be found in both bullish and bearish market. An example can be shown in the picture below.
Impulse waves
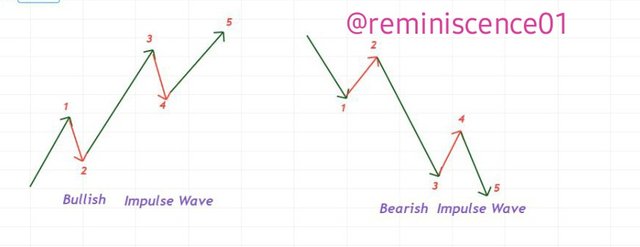
From what we have established above, the impulse wave moves in the direction of the overall trend. The impulse wave is represented by a 5 wave pattern. In this 5 wave pattern, wave 1-3-5 moves in the direction of the original trend, whereas wave 2-4 are corrective (pullbacks). This can be illustrated in the picture below.
Now let's discuss the psychology behind the 5 waves that make up the impulse waves.
Wave 1
Wave 1 represents the first circle of the impulse wave. This first wave happens when a small number of people feel like the price of an asset is cheap and they consider buying. When they buy the asset, this causes the price of the asset to rise.
Wave 2
When this small of people have purchased this asset, there are still other traders who got in position earlier. These earlier investors will think that the price is high and will consider taking a profit. And when they take profit by selling, we will see a pullback in the price of the asset which creates wave 2. Note that the pullback in wave 2 will not be equal to or lower than the previous low of wave 1.
Wave 3
As wave 1 and 2 have occurred, this asset has caught the attention of the public. Everyone wants to jump in due to FOMO ( Fear of missing out). This causes a spike in the price of the asset as many people jump in. This causes the price to break the previous high created by wave 1 and even extends further.
Wave 4
After this impulse move of wave 3, the price of the asset will be considered overvalued and traders take profits causing the price to pull back and create wave 4. Similarly, there are still traders who still believe in the overall trend and waiting for wave 4 to buy at a relatively low price (buying the dip).
Wave 5
At this point, traders waiting for the dip on wave 4 buy the asset. But at this point, most traders have already seen this asset as overbought. Though the trend is still bullish, we won't see many people jumping to buy the asset. This last few traders that bought the asset will push the price high above the previous high created by wave 3.
When wave 5 occur, the asset becomes overpriced as many people start selling off their positions. Nobody wants to buy an overpriced asset and nobody wants to leave money on the table. This causes profit-taking and shorting of the asset which gives rise to the corrective wave a-b-c.
Notes:
- Wave 3 is considered the longest wave because this is the point the asset gets the attention of the masses and everyone wants to FOMO in.
- Wave 2 shouldn't retrace to the previous low created by wave 1. The same is applicable to wave 4. It shouldn't retrace to the previous created by wave 2
- Also, the price of wave 3 should be higher than the previous high created by wave 1
Similarly, the price of wave 5 should be higher than the price created by ave 3.
Corrective Waves
The corrective waves (counter waves) occur after the price of an asset have made either a bullish rally or a bearish rally. Traders will feel that the price is overvalued and start shorting the asset and taking profits. The corrective waves move in the opposite direction of the main trend and it is labelled with letters a, b, c.
The corrective waves patterns are numerous and are difficult to spot in the market. But they are generally grouped into three formations to easily identify them. These includes:
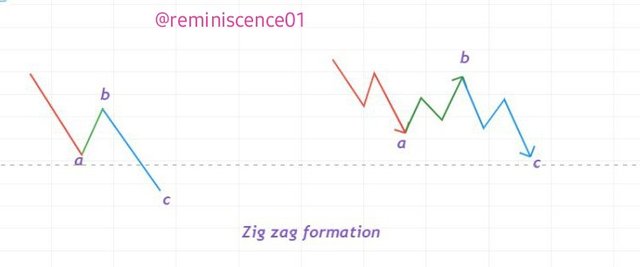
Zig-zag formation
This occurs when the corrective pattern forms a zigzag pattern. This means that wave b is shorter than wave a & c. Wave b moves in the opposite direction of the corrective wave, while wave a and c moves in the same direction as the main move (corrective wave).
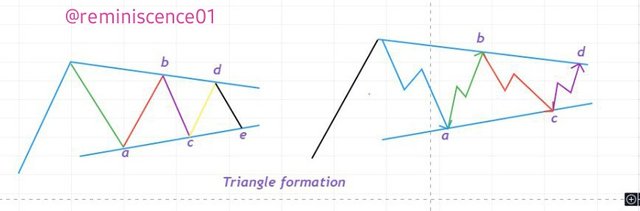
Triangle formation
Sometimes, corrective waves form triangle formation in the form of converging or diverging trendlines. These triangles can have multiple waves up to 5 waves to make up the triangle formation.
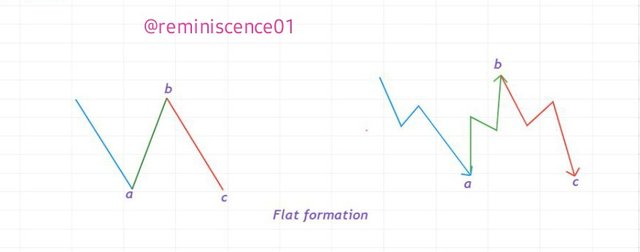
**Flat formations **
Flat formations occur when corrective waves sideways pattern with equal lengths. Wave B makes a complete retracement to wave A move and wave C makes complete retracement of wave B moves. This can be shown in the picture below.
By identifying these Elliot waves patterns, a trader has information on the current trend in the market and also know when is the best time to open a position. Similarly, these patterns can also help a trader to spot market reversals and get out of the market.
What are your thoughts on this theory? Why?
Just like every other technical analysis methods, each of them has pros and cons. I believe the market is not 100% predictable even though these patterns are spotted. EWT is a good technical tool that can assist a trader to make better trading decisions by knowing the overall movement of price. Also, EWT is a good tool that a trader can use to take advantage of market trends by spotting potential entry and exit points. Though EWT proves to be good by professionals who are trading based on the strategy. I do not recommend a trader to base his analysis on only EWT. Every technical tool for financial analysis should be combined with another tool like technical indicators or chart patterns to produce a high success rate. For EWT, technical trend-based indicators like RS1 and Stochastic can be used together with EWT to obtain a high success rate. These indicators can spot oversold and overbought conditions of price which can help a trader confirm EWT patterns when they are about to be formed.
Lastly, it is no doubt that trading is based on the emotions and psychology of traders which EWT is based on. If a trader can focus on recognizing EWT patterns and back them up with other technical tools or indicators, there will be a chance of predicting the market movement to spot potential entry and stop points.
Choose a coin chart in which you were able to spot all impulse and corrective waves and explain in detail what you see. Screenshots are required and make sure you name which cryptocurrency you are analysing.
For this section, I will perform my analysis on the chart of BTC/USD to spot EWT impulse and corrective waves. This will be carried out on the Tradingview chart.
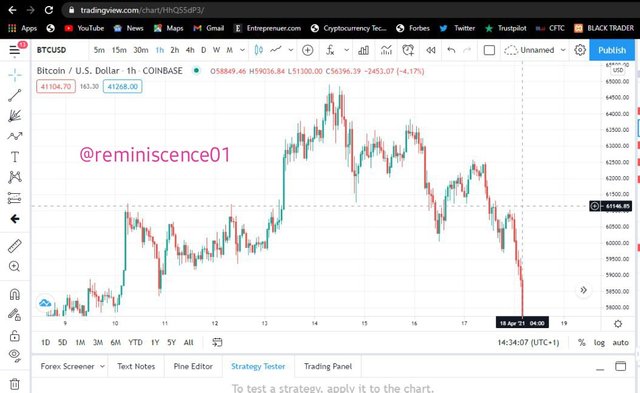
The picture above shows the 1-hour chart of BTC/USD. We all know that BTC has been in a bullish trend for some weeks. On the 14th of last month, BTC reached an all-time high of $64k and after that, we saw a reversal of what we can call profit-taking in the price of BTC. Now, we will apply EWT on this chart and also spot impulse waves and corrective waves. We will also analyse BTC/USD pair to spot potential opportunities using EWT.
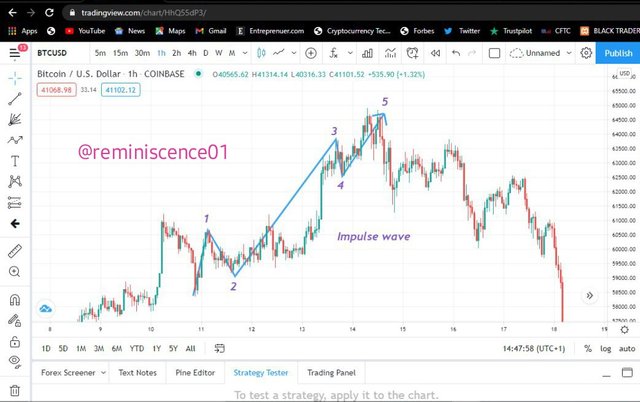
From the chart above, BTC hit an all-time high at $61k. Before then, it has already gotten the attention of the public by its recent bull run. After that, there was a pullback at $58.5k. A relatively small amount of traders still believed that BTC has the potential to go higher. So they bought BTC which further pushed the price to $60.7k for wave 1 of EWT impulse wave.
After that, early investors saw this move and needed to take profit from the move, this brought in sellers and price retraced to $59k forming wave 2 of EWT impulse wave. Since the price didn't retrace down to the low of wave 1 at $58.5k, this got the attention of the masses and there was a buying pressure in BTC. BTC surged to a new high at $63.7 k which formed the longest wave of EWT impulse wave (wave 3).
After that, the price of BTC seems to be overbought and there's was profit-taking and selling of BTC which corrected the price to 62.4k forming wave 4 of EWT impulse wave. Now after this, few people believed that BTC will go higher and they already waited for the dip (*wave 4) so they can buy at a low price. After that, we saw the price of BTC up at $64.8k which is the all-time high of BTC. And this move completed the 5 wave pattern of the EWT impulse wave.

The chart above shows the complete EWT wave. After BTC hit an all-time high at $64.8k, everyone felt that BTC is overvalued and there was massive profit-taking. This massive profit-taking brought in the sellers which pushed BTC price down to $61.5k forming wave a of EWT corrective wave. From the chart above, we have a zig-zag formation of EWT as price reversed to the opposite direction.
From the chart I have analysed, we can see how EWT can help us spot good entry and exit opportunities and also how we can identify that the market trend is weak and a possible reversal is about to happen. Similarly, this strategy can also help a trader maintain risk in the market by placing stoploss at strategic points which is the low point* of the retracement waves ( wave 2 and wave 4).
Important tips on EWT
- Wave 3 is the longest wave of the impulse wave.
- Wave 2 shouldn't retrace down to the low of wave 1.
- Wave 4 shouldn't retrace down to the low of wave 2.
- Wave b shouldn't retrace to the high of wave 5.
In conclusion, EWT is a good technical tool that aid in spotting market movements. EWT can help also help spot potential entries and exit point in a trending market. Though the market is fractal, that doesn't make ot easily predictable using EWT. Also, there's no technical confirmation for entry or exit the market using EWT. This is why it is necessary to combine EWT with other technical analysis tools to get the best trading result of the tool.
Note: All images used for illustrations in this post are designed by me. Similarly, all chart used in this post were screenshots taken from my Tradingview account, unless stated otherwise.
Thank you professor @fendit for this wonderful opportunity to learn a new tool to assist my technical analysis.
Twitter Promotion
Thank you for being part of my lecture and completing the task!
My comments:
Nice work on your explanations and analysis of this theory!
When it comes to the chart, I'm not really convinced by wave 3, it just doesn't seem to me that the pattern has been fully developed there!
Aside from that, it was really good!
Overall score:
6/10
There was little price consolidation before wave 3. During this consolidation, price neither broke the high of wave 1 nor the lows of wave 2. There was consolidation within the range and EWT pattern wasnt violated because price didn't reach the low of wave 2. Market consolidate sometimes before big moves like wave 3.
Meanwhile, thank you for your response. I will find a better example next time.