Crypto Academy Week 12 - Homework Post for professor @Kouba01 on Cryptocurrency Trading with RSI
Relative Strength Index (RSI)
There are so many tools and strategies that a trader to improve in making technical analysis. This can be chart patterns, candlestick analysis, use of indicators, etc. The use of technical indicators is essential to help the traded know the current situation in the market. The indicators can be trend-based, volatility-based, or momentum-based indicator. The emphasis on today's topic is on a volatility-based indicator or an Oscillator.
Volatility-based indicators are used to indicate how far the price has traveled and this can help a trader to know when the price of a given asset is in an overbought or oversold region. Similarly, these indicators can potentially be used as a trend reversal tool to know when the price of an asset is about to reverse. A good example of an Oscillator is the Relative Strength Index (RSI).
RSI is a momentum-based indicator or an Oscillator that evaluates when the price of an asset is in overbought or oversold conditions by measuring the speed and change of recent price movement of the asset. This indicator was developed by J.Welles Wilder Jr. to help traders in making technical analysis. The RSI displays a line graph on the chart which ranges from 0 - 100. There's a general interpretation that price is in the overbought condition when the RSI is above 70 and also, price is in the oversold region when the RSI is below 30. But this is a general interpretation, a trader who uses the RSI indicator can configure his own settings and interpretation based on his trading strategy. For example, a trader can consider an asset to be oversold when the RSI is below 20 and overbought when it is above 80.
We have discussed what RSI is and the interpretation for making a trading decision. Now let's talk about the RSI is calculated.
RSI is calculated using the formula:
RSI = 100 - [100/ (1+RS)]
Where,
RS = Average positive closes /Average negative closes.
RS is the relative strength value that is obtained by calculating the ratio of the average positive closes to the average negative closes over an 'N' period.
For example, let assume we have 14 periods i.e. the data for the price change for the last 14days is considered. An increase in the size and number of positive closes will lead to the rise of RSI and similarly, a decrease in size and number of negative closes will lead to the fall of the RSI.

Can we trust the RSI on cryptocurrency trading and why?
From my experience in using indicators, they cannot be trusted often and a trader shouldn't base his analysis on one indicator. Sometimes indicators give false signals and sometimes they may be leading or lagging behind the price. For a better and accurate signal from RSI, it should be used in conjunction with other indicators like Stochastic, Rate of change, MACD, Bollinger bands, etc. can help you spot when the RSI is giving a false signal.
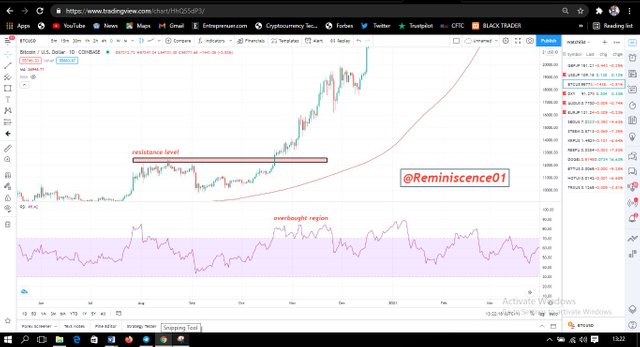
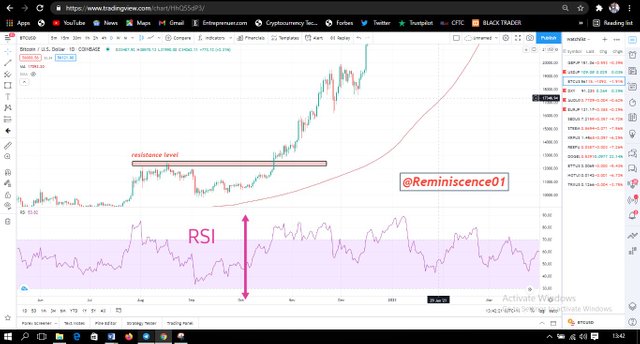
From the chart above, notice how the RSI remained in the overbought region for a long time and the price continued trading upper, the normal interpretation is that price is overbought and we should expect a reversal, but the price kept trending up. Using RSI in confluence with support and resistance as shown in the chart will tell the trader that we have broken a resistance level and the price will continue going up. This confluence has helped the trader not to initiate a sell trade because the RSI is in an overbought region.
RSI works best when in confluence with another oscillator like the Stochastic oscillator and also in confluence with a support and resistance level. This can give you more confirmation to have confidence in the information the RSI is giving and make a better trading decision. In conclusion, I would not trust RSI alone to make a trading decision, but I will trust it only when it is in confluence with other technical tools.
How do you configure the RSI indicator on the chart and what does the length parameter mean? Why is it equal to 14 by default? Can we change it?
I will explain how to configure the RSI indicator on the chart. This procedure will be explained on the Tradingview platform, so firstly, I will explain how to add the RSI indicator on the Tradingview chart.
Adding RSI on Tradingview Chart
Step 1:
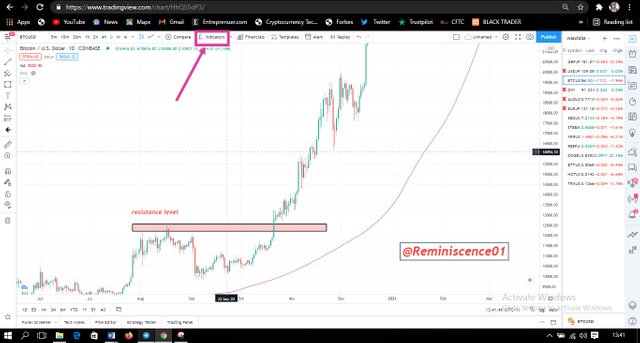
- On the tradingview chart, click your preferred cryptocurrency pair. I will select BTC/USD chart.
- Now click on Indicators at the top menu bar as shown in the picture below.
Step 2:
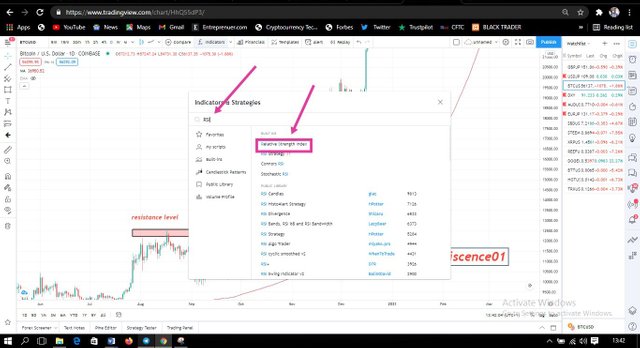
- After that, the indicator & Strategies page pops up. On the search bar, type RSI.
- Built-in RSI indicators on Tradingview appear, click on Relative Strength Index as shown in the picture below.
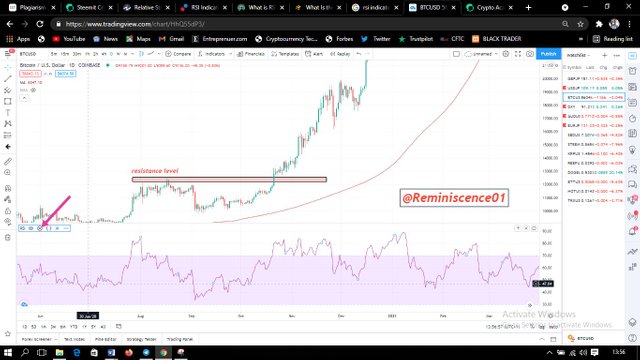
The chart below shows that RSI has been successfully added to my Chart.
How to Configure RSI indicator
RSI can be configured to suit a trader's strategy. This can be done by following the steps below.
Step 1:
- On the RSI pane on your chart, click on the settings icon. A pop-up page appears to configure RSI.
Step 2:
- On the RSI configuration page, we have three parameters. The first is the indicator timeframe by default, it is set as same as chart. I consider leaving it this way if you use a multi-timeframe pattern to trade. There's still an option to select an indicator timeframe. This can be done by clicking the arrow down.
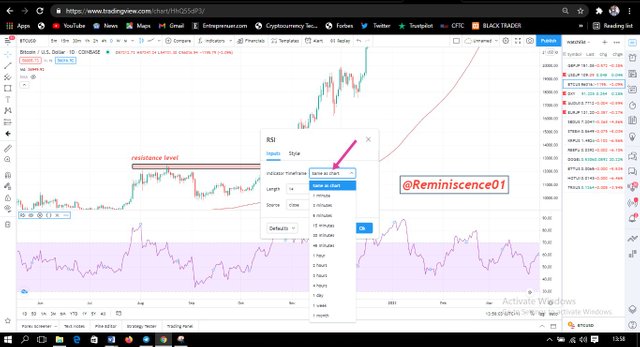
The next parameter is the length which will be explained later in this post.
- Another parameter is the Source which is set close by default. There are still other options available like the open, low, high, hl2, hlc3, etc.
Step 3:
The next configuration is the style. Click on the style to configure the appearance of the RSI on the chart.
Font color and chart type: Here you can select the line color, line thickness, and opacity of your chart. Similarly, you can also select the chart type. The chart type is a line chart by default.
Upper band and lower band: This is set at 70 and 30 by default. Traders can also choose their preferred levels based on their trading style. Some traders consider set their levels 80 and 20 but that's their own style.
Length
The Length is considered as the most sensitive parameter of the RSI which is used to calculate the average value over an 'N' period. The length determines the stability and volatility of the RSI and also the speed at which the RSI reacts to changing market conditions. By default, the RSI is set at 14 which means that the data for the price change in the last 14 days is taking into account.
Why the length is 14 by default
By default, the length of RSI is set at 14 which means that the indicators will calculate the bars for the past 14 days for a daily chart and calculate based on that. This varies depending on the timeframe you are using. 14 weeks on a weekly chart, 14 days for a daily chart, and 14hours for a 1hour chart, and so on. Like I said earlier, the length is very sensitive and determines how accurate and stable the RSI will be. The higher the period, the more stable the RSI chart will be and the more reliable the RSI will be. Similarly, the lesser the period, the more sensitive the RSI will be to change in price movement and the more infrequent signals the RSI will be due to an increase in volatility.
The chart below can show the sensitivity and effect of the length on RSI when the period is changed. Notice we have a more sensitive and volatile chart on RSI. But in period 14, there's less stability and volatility on the RSI chart.

Can it be Changed ?
Yes, it can be changed based on a trader's style or trading strategy. Swing traders prefer the default settings as they mostly make use of the 4hours and daily chart. The intraday traders often lower the period to get more sensitive trading signals on price movement. But all the same, it depends on the trading strategy and reason for using the indicator.
How do you interpret the overbought and oversold signals when trading cryptocurrencies?
When a price of an asset is overbought, it is considered to be overextended in price, and there may be a potential reversal or pullback in the price. This means there are more sellers in the market than buyers. Similarly, an asset is considered to be oversold when there is a significant downtrend in the price over a specific period and a possible reversal is expected. Indicators like RSI help us to identify when the price of an asset is overbought or oversold. The traditional interpretation of RSI indicated that the price of an asset is overbought when the RSI is above 70 and oversold when the RSI is below 30. This can be shown in the chart below.

Traders can use the overbought and oversold regions to expect price reversals. Notice how price reversed in the opposite direction after hitting the overbought and oversold region. This is just an indication and not a buy call or a sell call as sometimes price tends to remain in the overbought region during an uptrend and in an oversold region during a downtrend. Other confirmations are needed before taking a trade when the price reaches these regions.
How do we filter RSI signals to distinguish and recognize true signals from false signals?
When trading, the main idea is to focus on the price. RSI is an indication that something is about to happen. We notice that the RSI is in an overbought region but the price keeps making higher highs formation. Sometimes indicators give false signals due to market conditions and a trader must spot these fake signals. The RSI signal can be filtered when it is combined with other oscillators like the MACD, Stochastic, and William %. Also, the use of divergence can be used to filter RSI to give an accurate signal.
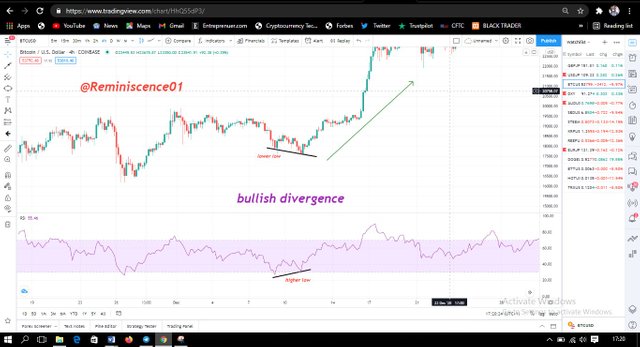
Divergence
Divergences occur when the price of an asset is in opposition to the RSI. A bullish divergence occurs when the price of an asset makes a lower low but the RSI makes a higher low formation. Divergence can be used to filter RSI signals when they occur and this can signal a reversal to the upside when it occurs. An example of a bullish divergence is shown below in the chart of BTC/USD. The use of divergence will work perfectly when the RSI higher low is formed at the oversold region.
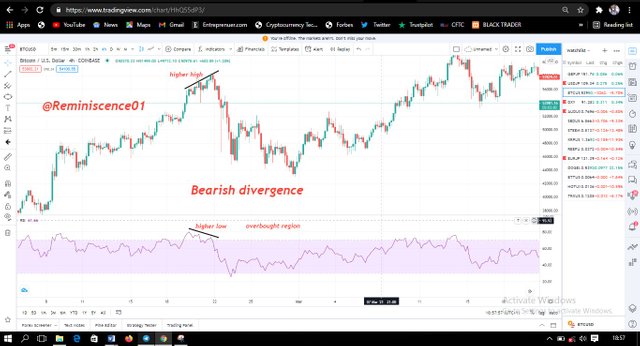
Similarly, a bearish divergence occurs when the price makes a higher high and the RSI makes a higher low. This indicates a possible reversal to the downside and this will be valid when the RSI peak is formed at the overbought region. An example is shown below.
Another way to filter the RSI signal is to combine it with another oscillator and see if the two oscillators are giving the same signal. From the chart below, I combined RSI and Stochastic oscillator and I found out that, both oscillators are giving out the same information and divergence. In this way, one can trust the RSI signal for price reversal.
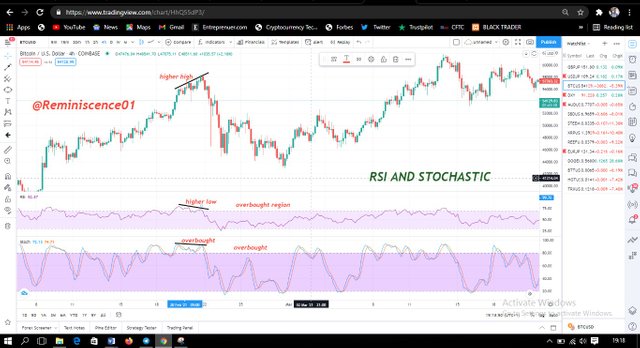
We can notice how both oscillators are indicating a reversal in the market. This is not all you need to enter a sell position, other tools like support and resistance and price action will be a plus to make a good entry.
Review the chart of any pair (eg TRX/USD) and present the various signals from the RSI.
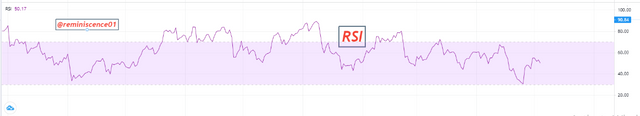
I'm going to look at BTC/USD chart to present the various signals from the RSI. This can be illustrated in the picture below.

From the chart above, we can see different signals a trader can capitalize on. Around late February, we can see a bullish divergence that was formed and we saw a reversal to the upside. Similarly, between 15th March to 12th April, we saw the RSI within the range of 30 and 70. RSI rarely entered the overbought and the oversold region. Traders can still incorporate other tools based on their trading strategy to make a trading decision.
After 13th April, We saw the RSI enter the overbought region above 70, we notice the price has made a new high since February, and there was a reversal in price after that. A good trade entry can be a formation of a bearish engulfing candle as the RSI falls below 70. Currently, we can see a bearish divergence between the RSI and the price movement, which is a good indication of price reversal and we can see a downward movement in price which have broken a structure in the chart pattern.
Currently, we can see the RSI approaching the oversold region, at this point, it's just to have patience as no trading decision can be made now based on RSI.
In conclusion, RSI is a powerful indicator that can help a trader find possible price reversals, but sometimes these indicators give false signals due to market conditions. Also, different traders configure RSI indicators based on their trading strategy. I recommend combining RSI with other oscillators and technical tools to filter out false signals and make better trading decisions.
Note: All charts used in this post are screenshots gotten from my Tradingview account.
Thank you professor @kouba01 for this amazing lesson.
Twitter Promotion
Please replace the hashtag kouba01-s2week4 with kouba-s2week4 .
Alright professor @kouba01. I have replaced it.
Thank you.
Hi @reminiscence01
Thanks for your participation in the Steemit Crypto Academy
Feedback
This is Excellent work. I enjoyed reading your article. Well detailed and well explained about the RSI trading indicator.
Homework task
10
Thank you professor @yohan2on.